Read Input Registers
\n";
for($i=0; $i < 32; $i+=2) {
    $j = $i+1;
    $register = $i/2;
    $register = str_pad($register+16,3," ", STR_PAD_LEFT);
    $hex = $result[$i].$result[$j];
    $hexout = hexdec($hex);
    $hex7e = $hexout & 0x7c;
    $lineout = "hex $register\tword ".$hex."\tdecimal ".$hexout; echo $lineout;
    //echo " hex Word  $hex \tdecimal ", hexdec($hex);
    if ($register==16) echo "\tAC charge power = ", (hexdec($hex)*0.1)," va";
    if ($register==17) echo "\tBattery voltage ",hexdec($hex)*0.01;
    if ($register==18) echo "\tBattery SOC ",hexdec($hex),"% (0, 25, 50, 75, 100)";
    if ($register==19) echo "\tBuss voltage ",hexdec($hex)*0.1;
    if ($register==20) echo "\tGrid voltage ",hexdec($hex)*0.1;
    if ($register==21) echo "\tLine frequency Hz ",hexdec($hex)*0.01;
    if ($register==22) echo "\tOutput voltage ",hexdec($hex)*0.1;
    if ($register==23) echo "\tAC output frequency Hz ",hexdec($hex)*0.01;
    if ($register==24) echo "\tOutput DC volt ",hexdec($hex)*0.1;
    if ($register==25) echo "\tInverter temperature ",hexdec($hex)*0.1,"C ",(hexdec($hex)*0.1)*9/5+32,"F $hex7e";
    if ($register==26) echo "\tDC-DC temperature ",hexdec($hex)*0.1,"C ",(hexdec($hex)*0.1)*9/5+32,"F $hex7e";
    if ($register==27) echo "\tAC output load ",hexdec($hex)*0.1, "%";
    if ($register==30) echo "\tAC input ",hexdec($hex)*0.1, " Watts";
    echo chr(10);
    $regnos[] = $result[$i] . $result[$j];
}
echo "
\n";
$modbus->deviceClose();
?>
deviceInit('/dev/ttyGW',9600,'none',8,2,'none');
//print_r($modbus);
//sleep(9);
// Open port
$modbus->deviceOpen();
//print_r($modbus);
//sleep(9);
# read registers 0-162
$regnos = array(); #Register Numbers 0-162
$startingaddress = str_pad(dechex(34), 4, "0", STR_PAD_LEFT); echo "\n$startingaddress\n";
echo "starting address = $startingaddress \n";
$Numberofpoints = str_pad(dechex(15), 4, "0", STR_PAD_LEFT); echo "\n$Numberofpoints\n";
$result=$modbus->sendQuery(1,3,"$startingaddress", 1);
print_r($result);
$modbus->deviceClose();
?>
deviceInit('/dev/ttyGW',9600,'none',8,2,'none');
//print_r($modbus);
//sleep(9);
// Open port
$modbus->deviceOpen();
//print_r($modbus);
//sleep(9);
// Enable debug
$modbus->debug = $debug;
# read registers 0-162
$regnos = array(); #Register Numbers 0-162
$startingaddress = str_pad(dechex(24), 4, "0", STR_PAD_LEFT); echo "\n$startingaddress\n";
echo "starting address = $startingaddress \n";
$Numberofpoints = str_pad(dechex(15), 4, "0", STR_PAD_LEFT); echo "\n$Numberofpoints\n";
$result=$modbus->sendQuery(1,3,"$startingaddress", 15);
if($debug) print_r($result);
//print ("1,3,$startingaddress,15");
//print_r($result);
//sleep(9);
print "pre";
for($i=0; $i < 30; $i+=2) {
$j = $i+1;
#echo $i/2+24, 'Word = ', $result[$i] . $result[$j], chr(10); // print $result[$i]; //print $result[$j]; $item = $i / 2; // print $item; $item1 = $item + 24; $item2 = $result[$i]; $item3 = $result[$j]; print "
$item1 Word $item2 $item3"; $regnos[] = $result[$i] . $result[$j]; } print ""; //echo "print_r regnos"; //print_r($regnos); $modbus->deviceClose(); ?>
$sql \n"; $db->exec($sql); #22222222222222222222222222222222222222222222222 $sql = "select serial, dt, csv from hrx order by dt $sql = "PRAGMA busy_timeout=20000"; $db->exec($sql); $sql = "PRAGMA busy_timeout=20000"; $db->exec($sql); "; $qr = $db->query($sql); while(list($serial, $dt, $csv) = $qr->fetchArray(SQLITE3_NUM)) { $hrxa = array(); $hrxa = explode(',', $csv); # print_r($hrxa); #scatter # Scatter array into discrete variable names. $Standby = hexdec($hrxa[0]); $OutputConfigId = hexdec($hrxa[1]) ; $ChargeConfigId = hexdec($hrxa[2]) ; $ACInModelId = hexdec($hrxa[8]) ; $OutputVoltTypeId = hexdec($hrxa[18]) ; $MaxChargeCurr = hexdec($hrxa[34]) ; $BulkChargeVolt = hexdec($hrxa[35]) * 0.1; $FloatChargeVolt = hexdec($hrxa[36]) * 0.1; $BatLowToUtiVolt = hexdec($hrxa[37]) * 0.1; $ACChargeCurr = hexdec($hrxa[38]) ; $BatteryTypeId = hexdec($hrxa[39]) ; #gather & write to table hr $sql = "insert into hr values( '$serial', '$dt' ,$Standby ,$OutputConfigId ,$ChargeConfigId ,$ACInModelId ,$OutputVoltTypeId ,$MaxChargeCurr ,$BulkChargeVolt ,$FloatChargeVolt ,$BatLowToUtiVolt ,$ACChargeCurr ,$BatteryTypeId )"; if($debug) echo "\n
$sql \n"; $db->exec($sql); }; print_r($hrxa); function hexdecs($hex) { //http://php.net/manual/en/function.hexdec.php#97172 // ignore non hex characters $hex = preg_replace('/[^0-9A-Fa-f]/', '', $hex); // converted decimal value: $dec = hexdec($hex); // maximum decimal value based on length of hex + 1: // number of bits in hex number is 8 bits for each 2 hex -> max = 2^n // use 'pow(2,n)' since '1 << n' is only for integers and therefore limited to integer size. $max = pow(2, 4 * (strlen($hex) + (strlen($hex) % 2))); // complement = maximum - converted hex: $_dec = $max - $dec; // if dec value is larger than its complement we have a negative value (first bit is set) return $dec > $_dec ? -$_dec : $dec; } ?> exec($sql); #1111111111111111111111111111111111 # insert discovered variable name(s). Keep in seq by regNO $sql = "drop table if exists ir; CREATE TABLE if not exists ir ( serial text , dt text , SystemStatusId text --0 , Vpv1 num --1 0.1V , Ppv1 num --3,4 0.1W , Buck1Cur num --7 0.1A , OP_Watt num --9 0.1W , OP_VA num --11 0.1VA , ACChr_Watt num --13 0.1VA , ACChr_VA num --15 0.1VA , BatVolt num --17 , BatSOC num --18 % , BusVolt num --19 0.1V , GridVolt num --20 0.1V , LineFreq num --21 0.01Hz , OutputFreq num --23 , WorkTime num --30,31 , AC_InWatt num --36-37 0.1W , AC_InVA num --38-39 0.1W , Epv1_today num --48,49 0.1kWh , Epv1_total num --50,51 0.1kWh , Eac_chrToday num --56-57 0.1kWh , Eac_chrTotal num --58-59 0.1kWh , Ebat_dischrToday num --60,61 0.1kWh , Ebat_dischrTotal num --62,63 0.1kWh , Eac_dischrToday num --64-65 0.1kWh , Eac_dischrTotal num --66-67 0.1kWh , Bat_Watt num --77 0.1W , Eop_dischrToday num --85-86 0.1kWh , Eop_dischrTotal num --87-88 0.1kWh , PRIMARY KEY(serial, dt) )"; if($debug) echo "\n
$sql \n"; $db->exec($sql); #22222222222222222222222222222222222222222222222 $sql = "select dt, csv from irx"; $qr = $db->query($sql); while(list($dt, $csv) = $qr->fetchArray(SQLITE3_NUM)) { $irxa = array(); $irxa = explode(',', $csv); #scatter # Scatter array into discrete variable names. $serial = "UKDGBMF010"; $SystemStatusId = hexdec($irxa[0]); $Vpv1 = hexdec($irxa[1]) * 0.1; $Ppv1 = hexdec($irxa[3] . $irxa[4]) * 0.1; $Buck1Cur = hexdec($irxa[7]) * 0.1; $OP_Watt = hexdec($irxa[9] . $irxa[10]) * 0.1; $OP_VA = hexdec($irxa[11] . $irxa[12]) * 0.1; $ACChr_Watt = hexdec($irxa[13] . $irxa[14]) * 0.1; $ACChr_VA = hexdec($irxa[15] . $irxa[16]) * 0.1; $BatVolt = hexdec($irxa[17]) * 0.01; $BatSOC = hexdec($irxa[18]) ; $BusVolt = hexdec($irxa[19]) * 0.1; $GridVolt = hexdec($irxa[20]) * 0.1; $LineFreq = hexdec($irxa[21]) * 0.01; $OutputFreq = hexdec($irxa[22]) * 0.1; $WorkTime = hexdec($irxa[30] . $irxa[31]) * 0.5; #Seconds $AC_InWatt = hexdec($irxa[36] . $irxa[37]) * 0.1; $AC_InVA = hexdec($irxa[38] . $irxa[39]) * 0.1; $Epv1_today = hexdec($irxa[48] . $irxa[49]) * 0.1; $Epv1_total = hexdec($irxa[50] . $irxa[51]) * 0.1; $Eac_chrToday = hexdec($irxa[56] . $irxa[57]) * 0.1; $Eac_chrTotal = hexdec($irxa[58] . $irxa[59]) * 0.1; $Ebat_dischrToday = hexdec($irxa[60] . $irxa[61]) * 0.1; $Ebat_dischrTotal = hexdec($irxa[62] . $irxa[63]) * 0.1; $Eac_dischrToday = hexdec($irxa[64] . $irxa[65]) * 0.1; $Eac_dischrTotal = hexdec($irxa[66] . $irxa[67]) * 0.1; $Bat_Watt = hexdecs($irxa[77] . $irxa[78]) * 0.1; #signed 32bit word $Eop_dischrToday = hexdec($irxa[85] . $irxa[86]) * 0.1; $Eop_dischrTotal = hexdec($irxa[87] . $irxa[88]) * 0.1; #gather & write to table ir; be sure to enclose TEXT values in 's !! $sql = "insert into ir values( '$serial', '$dt', '$SystemStatusId', $Vpv1, $Ppv1, $Buck1Cur, $OP_Watt, $OP_VA, $ACChr_Watt, $ACChr_VA, $BatVolt, $BatSOC, $BusVolt, $GridVolt, $LineFreq, $OutputFreq, $WorkTime, $AC_InWatt, $AC_InVA, $Epv1_today, $Epv1_total, $Eac_chrToday, $Eac_chrTotal, $Ebat_dischrToday, $Ebat_dischrTotal, $Eac_dischrToday, $Eac_dischrTotal, $Bat_Watt, $Eop_dischrToday, $Eop_dischrTotal )"; if($debug) echo "\n
$sql \n"; $db->exec($sql); }; function hexdecs($hex) { //http://php.net/manual/en/function.hexdec.php#97172 // ignore non hex characters $hex = preg_replace('/[^0-9A-Fa-f]/', '', $hex); // converted decimal value: $dec = hexdec($hex); // maximum decimal value based on length of hex + 1: // number of bits in hex number is 8 bits for each 2 hex -> max = 2^n // use 'pow(2,n)' since '1 << n' is only for integers and therefore limited to integer size. $max = pow(2, 4 * (strlen($hex) + (strlen($hex) % 2))); // complement = maximum - converted hex: $_dec = $max - $dec; // if dec value is larger than its complement we have a negative value (first bit is set) return $dec > $_dec ? -$_dec : $dec; } ?> query($sql)->fetchArray(SQLITE3_NUM); if($debug) echo "\n $serial, $dtasof"; $title = " GW Battery 193 Hours $dtasof "; # Data for plot #1: $y_title1 = 'SOC%'; $data1 = array(); #$sql = "select case when strftime('%M', dt) = '00' then strftime('%H', dt) else '' end , BatSOC, -Bat_Watt from period25hrs order by dt" ; $sql = "select case when strftime('%M', dt) = '00' then strftime('%H', dt) else '.' end , BatSOC from ir order by dt" ; #@# where dt >= (select datetime(max(dt), '-25 hour') from period25hrs) order by dt" ; #@# where date(dt) = (select date(max(dt)) from period25hrs) order by dt"; if($debug) echo "\n$sql"; $qr = $db->query($sql); while($row = $qr->fetchArray(SQLITE3_NUM)) { $data1[] = $row; if($debug) echo'.'; } if($debug) print_r($data1); $legend1 = array('SOC%'); # Data for plot #2: $y_title2 = 'Volts'; $data2 = array(); #$sql = "select NULL, BatVolt, 8*3.375, 25.6 from ir order by dt" ; #Balance, AGM Low Float, AGM 50% $sql = "select NULL, BatVolt, 8*3.45, 25.6 from ir order by dt" ; #Balance, LiFePO4 100% SOC, SOC 10% 20221202 if($debug) echo "\n$sql"; $qr = $db->query($sql); while($row = $qr->fetchArray(SQLITE3_NUM)) { $data2[] = $row; if($debug) echo'.'; } if($debug) print_r($data2); #$legend2 = array('Bat', 'BMS Bal', 'Low Bat'); $legend2 = array('Bat', 'Charge target', 'SOC 10%'); # battery cell voltage range # list($bulknbr) = $db->query( "select count(*) from ir where charge_state = 5 and dt > datetime('now','localtime','-1 days')" )->fetchArray(SQLITE3_NUM); #$sql = "select min(25.6, min(BatVolt))-0.1, max(28.2, max(BatVolt))+0.1 from ir order by dt" ; $sql = "select min(25.6, min(BatVolt))-0.1, max(28.0, max(BatVolt))+0.1 from ir order by dt" ; #20221202 if($debug) echo "\n$sql"; list($lv, $uv) = $db->query($sql)->fetchArray(SQLITE3_NUM); # $plot = new PHPlot(1280, 620); $plot->SetImageBorderType('plain'); // For presentation in the manual $plot->SetPrintImage(False); // Defer output until the end $plot->SetTitle($title); $plot->SetLightGridColor('black'); // So grid stands out from background # Plot 1 # Set margins to leave room for plot 2 Y title on the right. $plot->SetMarginsPixels(56, 56); #$plot->SetPlotBgColor('gray'); $plot->SetDrawPlotAreaBackground(True); $plot->SetPlotType('linepoints'); $plot->SetDataType('text-data'); $plot->SetDataValues($data1); $plot->SetYTitle($y_title1); # Set and position legend #1: $plot->SetLegendUseShapes(true); #false = boxes or true = shapes ####<===== add this line $plot->SetLegend($legend1); $plot->SetLegendPixels(58, 27); # Colors are significant to this data: $plot->SetDataColors(array('navy', 'maroon')); # Specify Y range of these data sets: $plot->SetPlotAreaWorld(NULL, NULL, NULL, NULL); #$plot->SetYTickIncrement(500); $plot->SetXTitle('Hours'); $plot->SetXTickLabelPos('none'); $plot->SetXTickPos('none'); # Format Y tick labels as integers, with thousands separator: #$plot->SetYLabelType('data', 0); $plot->SetPointSizes('5','9'); $plot->SetLineWidths('1','9'); $plot->SetPointShapes('circle','cross'); $plot->SetPlotType('squared'); $plot->DrawGraph(); # Plot 2 $plot->SetDrawPlotAreaBackground(False); // Cancel background $plot->SetDrawYGrid(False); // Cancel grid, already drawn $plot->SetPlotType('linepoints'); $plot->SetDataValues($data2); # Set Y title for plot #2 and position it on the right side: $plot->SetYTitle($y_title2, 'plotright'); # Set and position legend #2: $plot->SetLegend($legend2); $plot->SetLegendPixels(400, 25); # Colors are significant to this data: $plot->SetDataColors(array('navy')); # Specify Y range of this data set: $plot->SetPlotAreaWorld(NULL, $lv, NULL, $uv); $plot->SetYTickIncrement(.2); $plot->SetYTickPos('plotright'); $plot->SetYTickLabelPos('plotright'); $plot->SetDataColors(array('black', 'gold', 'orchid')); # Format Y tick labels as integers with trailing percent sign: $plot->SetYLabelType('data', 2); $plot->SetYTickAnchor(3.2); $plot->SetPointSizes('5','5','5','5'); $plot->SetLineWidths('1','1','1','4'); $plot->SetPointShapes('dot','cross','line'); $plot->DrawGraph(); # Now output the graph with both plots: if(!$debug) $plot->PrintImage(); ################################################################################################################################################
See also battery voltage history and solar panel wattage history.
Do you see a value of 2 here and 'Utl' on GW blue screen? If yes, then success!/n"; echo "\n"; ?> query($sql)->fetchArray(SQLITE3_NUM); if($debug) echo "\n $dtasof, $p01,$p02,$p11,$p12,$p13,$p14,$p19,$p20,$p21"; $title = " GW Battery 4 Hours V2 $dtasof "; # Data for plot #1: $y_title1 = 'SOC%'; $data1 = array(); $sql = "select case when strftime('%M', dt) = '00' then strftime('%H', dt) else '.' end , nullif(Vpv1,0), nullif(Buck1Cur,0), nullif(round(ACChr_Watt/BatVolt),0), batsoc from ir where dt >= (select datetime(max(dt), '-4 hour') from ir) order by dt" ; #@# where dt >= (select datetime(max(dt), '-4 hour') from period25hrs) order by dt" ; #@# where date(dt) = (select date(max(dt)) from period25hrs) order by dt"; if($debug) echo "\n$sql"; $qr = $db->query($sql); while($row = $qr->fetchArray(SQLITE3_NUM)) { $data1[] = $row; if($debug) echo'.'; } if($debug) print_r($data1); $legend2 = array('BatVolts', ">=($p19+$p20).0.5", "<=$p12", "<=($p21+$p12)*0.5"); # Data for plot #2: $y_title2 = 'Volts'; #flag/warning boxes $box19 = $p19; $box20 = $p20; $box12 = $p12+.4; $box21 = $p21+1; $data2 = array(); #Adjust for sane volts between over and low voltage disconnect $sql = "select NULL, (batvolt), case when (batvolt) >= $p19 then $p19 end , case when (batvolt) <= $box12 then $p12 end, case when (batvolt) <= $box21 then $p21 end from ir where dt >= (select datetime(max(dt), '-4 hour') from ir) order by dt" ; if($debug) echo "\n$sql"; $qr = $db->query($sql); while($row = $qr->fetchArray(SQLITE3_NUM)) { $data2[] = $row; if($debug) echo'.'; } if($debug) print_r($data2); $legend2 = array('BatVolts', ">=$p19", "<=$box12", "<=$box21"); # $plot = new PHPlot(1500, 400); $plot->SetImageBorderType('plain'); // For presentation in the manual $plot->SetPrintImage(False); // Defer output until the end $plot->SetTitle($title); $plot->SetLightGridColor('black'); // So grid stands out from background # Plot 1 # Set margins to leave room for plot 2 Y title on the right. $plot->SetMarginsPixels(150,150); #$plot->SetPlotBgColor('gray'); $plot->SetDrawPlotAreaBackground(True); $plot->SetPlotType('points'); $plot->SetDataType('text-data'); $plot->SetDataValues($data1); $plot->SetYTitle($y_title1); # Set and position legend #1: $plot->SetLegend(array('PVvolts', 'PV Amps', 'Grid Amps', 'SOC% < 100')); $plot->SetLegendPixels(25, 25); $plot->SetLegendUseShapes(true); #false = boxes or true = shapes # Colors are significant to this data: $plot->SetPointShapes(array('star','star', 'plus','hourglass')); $plot->SetDataColors(array('blue', 'maroon', 'navy')); # Specify Y range of these data sets: $plot->SetPlotAreaWorld(NULL, NULL, NULL, NULL); #$plot->SetYTickIncrement(500); $plot->SetXTitle("Hours 01=$p01,02=$p02,11=$p11,12=$p12,13=$p13,14=$p14,19=$p19,20=$p20,21=$p21"); $plot->SetXTickLabelPos('none'); $plot->SetXTickPos('none'); # Format Y tick labels as integers, with thousands separator: #$plot->SetYLabelType('data', 0); $plot->DrawGraph(); # Plot 2 $plot->SetDrawPlotAreaBackground(False); // Cancel background $plot->SetDrawYGrid(False); // Cancel grid, already drawn $plot->SetPlotType('linepoints'); $plot->SetDataValues($data2); # Set Y title for plot #2 and position it on the right side: $plot->SetYTitle($y_title2, 'plotright'); # Set and position legend #2: $plot->SetLegend($legend2); $plot->SetLegendPixels(1400, 25); $plot->SetLegendUseShapes(true); #false = boxes or true = shapes # Colors are significant to this data: $plot->SetDataColors(array('navy')); # Specify Y range of this data set: $plot->SetPlotAreaWorld(NULL, NULL, NULL, NULL); $plot->SetYTickIncrement(.1); $plot->SetYTickPos('plotright'); $plot->SetYTickLabelPos('plotright'); $plot->SetPointShapes(array('hourglass','box','box','box')); $plot->SetDataColors(array('black', 'maroon', 'orange', 'red')); # Format Y tick labels as integers with trailing percent sign: $plot->SetYLabelType('data', 2); #$plot->SetYTickAnchor(3.2); $plot->DrawGraph(); # Now output the graph with both plots: if(!$debug) $plot->PrintImage(); ################################################################################################################################################ query($sql)->fetchArray(SQLITE3_NUM); if($debug) echo "\n $p11, $dtasof"; $dcd_load= 45+55; #GW + 24VDC van freezer $title = " GW Watts 4 hours V1 $dtasof"; # Data for plot #2: $y_title2 = 'Watts'; $data = array(); #select dt, systemstatusid as ss, Ppv1 as 'Solar:', AC_InWatt as 'Import:', OP_Watt as 'Consumption Power:', Bat_Watt as 'Dis(Charge) +(-)' from ir order by dt desc limit 7; $sql = "select case when strftime('%M', dt) = '00' then strftime('%H', dt) else '.' end, nullif((Ppv1),0), nullif((ACChr_Watt),0), nullif((AC_InWatt-ACChr_Watt),0)Bypass, Bat_Watt, nullif((OP_Watt),0), 100 as DCD from ir where dt >= (select datetime(max(dt), '-4 hour') from ir) " ; if($debug) echo "\n$sql"; $qr = $db->query($sql); while($row = $qr->fetchArray(SQLITE3_NUM)) { $data[] = $row; if($debug) echo'.'; } if($debug) print_r($data); # $plot = new PHPlot(1500, 400); $plot->SetMarginsPixels(150, 150); $plot->SetImageBorderType('plain'); // For presentation in the manual $plot->SetTitle($title); $plot->SetLightGridColor('black'); // So grid stands out from background #$plot->SetDrawPlotAreaBackground(False); // Cancel background $plot->SetDrawYGrid(True); $plot->SetPlotType('linepoints'); $plot->SetDataValues($data); # Set Y title for plot #2 and position it on the right side: $plot->SetYTitle($y_title2, 'plotright'); # Set and position legend #1: $plot->SetLegendPixels(1400, 25); $plot->SetLegend(array('Solar', 'Charge', 'Bypass', 'Bat', 'Load', 'DCD')); $plot->SetLegendUseShapes(true); #false = boxes or true = shapes # Colors are significant to this data: # Specify Y range of this data set: $plot->SetPlotAreaWorld(NULL, NULL, NULL, NULL); #$plot->SetYTickIncrement(100); $plot->SetYTickPos('plotright'); $plot->SetYTickLabelPos('plotright'); $plot->SetPointShapes(array('star','plus','plus', 'hourglass', 'target', 'hourglass')); $plot->SetDataColors(array('gold', 'blue', 'red', 'maroon','red', 'red')); # Format Y tick labels as integers with trailing percent sign: $plot->SetYLabelType('data',0); #$plot->SetYTickIncrement(500); $plot->SetXTitle("Hours Pnos01=$p01,02=$p02,11=$p11,12=$p12,13=$p13,14=$p14,19=$p19,20=$p20,21=$p21"); #$plot->SetYTickAnchor(3.2); # Turn off X tick labels and ticks because they don't apply here: $plot->SetXTickLabelPos('none'); $plot->SetXTickPos('none'); $plot->DrawGraph(); if(!$debug) $plot->PrintImage(); ################################################################################################################################################ query($sql)->fetchArray(SQLITE3_NUM); if($debug) echo "\n $dtasof, $p01,$p02,$p11,$p12,$p13,$p14,$p19,$p20,$p21"; $title = "eis GW Daily Battery $dtasof"; # Data for plot #1: $y_title1 = 'Legend'; $sql = "select case when strftime('%H', dt) = '00' then strftime('%d', dt) else '.' end Day, SystemStatusID, nullif(avg(Buck1Cur),0), nullif(avg(ACChr_Watt/BatVolt),0), case when avg(BatSOC) < 50 then avg(batsoc) end from ir where date(dt) > (select date(max(dt), '-8 days') from ir) group by strftime('%Y%m%d%H', dt), 0+SystemStatusID" ; if($debug) echo "\n$sql"; $qr = $db->query($sql); $data1 = array(); while($row = $qr->fetchArray(SQLITE3_NUM)) { $data1[] = $row; if($debug) echo'.'; } if($debug) print_r($data1); # Data for plot #2: $y_title2 = 'Volts'; #flag/warning boxes $box19 = $p19; $box20 = $p20; $box12 = $p12+.4; $box21 = $p21+1; #Include the flags. When grouping, use appropriate min or max. $sql = "select NULL, avg(batvolt), case when max(batvolt) >= $p20 then $p20 end , case when min(batvolt) <= $box12 then $p12 end, case when min(batvolt) <= $box21 then $p21 end from ir group by strftime('%Y%m%d%H', dt), 0+SystemStatusID" ; if($debug) echo "\n$sql"; $qr = $db->query($sql); $data2 = array(); while($row = $qr->fetchArray(SQLITE3_NUM)) { $data2[] = $row; if($debug) echo'.'; } if($debug) print_r($data2); $legend2 = array('BatVolts', ">=$box20", "<=$box12", "<=$box21"); # $plot = new PHPlot(1500, 400); $plot->SetMarginsPixels(150,150); $plot->SetImageBorderType('plain'); // For presentation in the manual $plot->SetPrintImage(False); // Defer output until the end $plot->SetTitle($title); $plot->SetLightGridColor('black'); // So grid stands out from background # Plot 1 # Set margins to leave room for plot 2 Y title on the right. #$plot->SetPlotBgColor('gray'); $plot->SetDrawPlotAreaBackground(True); $plot->SetPlotType('points'); $plot->SetDataType('text-data'); $plot->SetDataValues($data1); $plot->SetYTitle($y_title1); # Set and position legend #1: $plot->SetLegend(array('SysStat', 'PV Amps', 'Grid Amps', 'SOC% < 50')); $plot->SetLegendPixels(25, 25); $plot->SetLegendUseShapes(true); #false = boxes or true = shapes # Colors are significant to this data: $plot->SetPointShapes(array('circle','star', 'plus','hourglass')); $plot->SetDataColors(array('blue', 'maroon', 'navy')); # Specify Y range of these data sets: $plot->SetPlotAreaWorld(NULL, NULL, NULL, NULL); #$plot->SetYTickIncrement(500); $plot->SetXTitle("Hours 01=$p01,02=$p02,11=$p11,12=$p12,13=$p13,14=$p14,19=$p19,20=$p20,21=$p21"); $plot->SetXTickLabelPos('none'); $plot->SetXTickPos('none'); # Format Y tick labels as integers, with thousands separator: #$plot->SetYLabelType('data', 0); $plot->DrawGraph(); # Plot 2 $plot->SetDrawPlotAreaBackground(False); // Cancel background $plot->SetDrawYGrid(False); // Cancel grid, already drawn $plot->SetPlotType('points'); $plot->SetDataValues($data2); # Set Y title for plot #2 and position it on the right side: $plot->SetYTitle($y_title2, 'plotright'); # Set and position legend #2: $plot->SetLegend($legend2); $plot->SetLegendPixels(1400, 25); $plot->SetLegendUseShapes(true); #false = boxes or true = shapes # Colors are significant to this data: $plot->SetDataColors(array('navy')); # Specify Y range of this data set: $plot->SetPlotAreaWorld(NULL, NULL, NULL, NULL); $plot->SetYTickIncrement(.2); $plot->SetYTickPos('plotright'); $plot->SetYTickLabelPos('plotright'); $plot->SetPointShapes(array('hourglass','box','box','box')); $plot->SetDataColors(array('black', 'maroon', 'orange', 'red')); # Format Y tick labels as integers with trailing percent sign: $plot->SetYLabelType('data', 2); #$plot->SetYTickAnchor(3.2); $plot->DrawGraph(); # Now output the graph with both plots: if(!$debug) $plot->PrintImage(); ################################################################################################################################################ loadExtension('libsqlitefunctions.so'); $sql = "PRAGMA busy_timeout=6000"; #get today's as-of dt for title $sql = "select dt from ir order by dt desc limit 1 " ; if($debug) echo "\n$sql"; list($dtasof) = $db->query($sql)->fetchArray(SQLITE3_NUM); if($debug) echo "\n $dtasof"; $dcd_load = 1; #kWhs for DCdirect +DC_load /* $data = array(); $sql = "select case when strftime('%M', End.dt) = '00' then strftime('%H', End.dt) else '.' end as Hour, avg(End.Epv1_total-Beg.Epv1_total) as Epv1_today, avg(End.Eac_chrTotal-Beg.Eac_chrTotal) as Eac_chrToday, avg(End.Eac_dischrTotal-Beg.Eac_dischrTotal) as Eac_dischrToday, avg(End.Eop_dischrTotal + $dcd_load -Beg.Eop_dischrTotal) as Eop_dischrToday, round(End.Ebat_dischrTotal-Beg.Ebat_dischrTotal) as Ebat_dischrToday from ir as End, (select rowid, dt,Epv1_total, Eac_chrTotal, Eac_dischrTotal, Eop_dischrTotal, Ebat_dischrTotal from ir where dt >= (select datetime(max(dt), '-25 hour') from ir) order by dt limit 1) as Beg where End.dt >= Beg.dt group by strftime('%Y%m%d%H', End.dt) "; */ $sql = "drop table if exists temp.calkwhs; create table temp.calkwhs as select max(dt) dt from ir group by date(dt)"; $db->exec($sql); $sql = "drop table if exists temp.irdb; create table temp.irdb as select date(dt)dt, Epv1_total solar, Ebat_dischrTotal as discharged, Epv1_total + Eac_chrTotal as charged, Eac_chrTotal + Eac_dischrTotal as grid, Eop_dischrTotal as load from ir, temp.calkwhs using(dt) order by dt desc"; $db->exec($sql); $sql = "select b.dt, round(b.solar-a.solar,1)solar, round(1.6+b.discharged-a.discharged,1)discharged, round(b.charged-a.charged,1)charged, round(b.grid-a.grid,1)grid, round(b.load-a.load,1)load from temp.irdb b, temp.irdb a where a.dt = date(b.dt,'-1 day') order by b.dt"; ## cal.rowid*(100)dcd_load if($debug) echo "\n$sql"; $qr = $db->query($sql); while($row = $qr->fetchArray(SQLITE3_NUM)) { $data[] = $row; if($debug) echo'.'; } if($debug) print_r($data); $plot = new PHPlot(1500, 400); $plot->SetImageBorderType('plain'); $plot->SetMarginsPixels(150, 150); $plot->SetLightGridColor('black'); $plot->SetPlotType('bars'); $plot->SetDataType('text-data'); $plot->SetDataValues($data); # Main plot title: $plot->SetTitle("GW kWhs Daily: $dtasof"); $plot->SetXTitle('Date'); # Set Y data limits, tick increment, and titles: $plot->SetPlotAreaWorld(NULL, NULL, NULL, NULL); $plot->SetYTickIncrement(.5); $plot->SetYTitle('kWhs','plotright'); $plot->SetYTickPos('plotright'); $plot->SetYTickLabelPos('plotright'); # Colors and Shapes: $plot->SetPointShapes(array('star','hourglass', 'hourglass', 'plus', 'target')); $plot->SetDataColors(array( 'gold', 'red', 'maroon', 'navy', 'orange')); #$plot->SetPlotBgColor('grey'); $plot->SetDrawPlotAreaBackground(True); $plot->SetLegend(array('Solar','Dischgd','Charged','Grid','Load')); $plot->SetLegendPixels(1400, 25); $plot->SetLegendUseShapes(true); #false = boxes or true = shapes # Turn off X tick labels and ticks because they don't apply here: $plot->SetXTickLabelPos('none'); $plot->SetXTickPos('none'); if(!$debug) $plot->DrawGraph(); ?>
$sql \n"; $db->exec($sql); #22222222222222222222222222222222222222222222222 $sql = "select serial, dt, csv from hrx where dt = (select max(dt) as dt from hrx)"; $qr = $db->query($sql); while(list($serial, $dt, $csv) = $qr->fetchArray(SQLITE3_NUM)) { $hrxa = array(); $hrxa = explode(',', $csv); # print_r($hrxa); #scatter # Scatter array into discrete variable names. $Standby = hexdec($hrxa[0]); $OutputConfigId = hexdec($hrxa[1]) ; $ChargeConfigId = hexdec($hrxa[2]) ; $ACInModelId = hexdec($hrxa[8]) ; $OutputVoltTypeId = hexdec($hrxa[18]) ; $MaxChargeCurr = hexdec($hrxa[34]) ; $BulkChargeVolt = hexdec($hrxa[35]) * 0.1; $FloatChargeVolt = hexdec($hrxa[36]) * 0.1; $BatLowToUtiVolt = hexdec($hrxa[37]) * 0.1; $ACChargeCurr = hexdec($hrxa[38]) ; $BatteryTypeId = hexdec($hrxa[39]) ; $BatCutOffVol = hexdec($hrxa[82]) * 0.1; $Uti2BatVolt = hexdec($hrxa[95]) * 0.1; #gather & write to table hr $sql = "insert into hr values( '$serial', '$dt' ,$Standby ,'$OutputConfigId' ,'$ChargeConfigId' ,'$ACInModelId' ,'$OutputVoltTypeId' ,$MaxChargeCurr ,$BulkChargeVolt ,$FloatChargeVolt ,$BatLowToUtiVolt ,$ACChargeCurr ,$BatteryTypeId ,$BatCutOffVol ,$Uti2BatVolt )"; echo "\n
$sql \n"; $db->exec($sql); }; if($debug) print_r($hrxa); function hexdecs($hex) { //http://php.net/manual/en/function.hexdec.php#97172 // ignore non hex characters $hex = preg_replace('/[^0-9A-Fa-f]/', '', $hex); // converted decimal value: $dec = hexdec($hex); // maximum decimal value based on length of hex + 1: // number of bits in hex number is 8 bits for each 2 hex -> max = 2^n // use 'pow(2,n)' since '1 << n' is only for integers and therefore limited to integer size. $max = pow(2, 4 * (strlen($hex) + (strlen($hex) % 2))); // complement = maximum - converted hex: $_dec = $max - $dec; // if dec value is larger than its complement we have a negative value (first bit is set) return $dec > $_dec ? -$_dec : $dec; } ?> exec($sql); #1111111111111111111111111111111111 # insert discovered variable name(s). Keep in seq by Program Number #Columns #Variable Name, MODBUSRegNO, Value, Unit, Program/Alias $sql = "CREATE TABLE if not exists hr ( serial text , dt text , Standby text --0 0-1 P04 , OutputConfigId text --1 0-3 P01 , ChargeConfigId text --2 0-2 P14 , ACInModelId text --8 0-2 P03 , OutputVoltTypeId text --9 0-6 P08 , MaxChargeCurr num --34 A P02 , BulkChargeVolt num --35 0.1V P19 , FloatChargeVolt num --36 0.1V P20 , BatLowToUtiVolt num --37 0.1V P12 , ACChargeCurr num --38 0.1V P11 , BatteryTypeId text --39 0-4 P05 , Uti2BatVolt num --95 0.1V P13 , PRIMARY KEY(serial, dt) )"; if($debug) echo "\n
$sql \n"; $db->exec($sql); #22222222222222222222222222222222222222222222222 $sql = "select serial, dt, csv from hrx where dt = (select max(dt) as dt from hrx)"; $qr = $db->query($sql); while(list($serial, $dt, $csv) = $qr->fetchArray(SQLITE3_NUM)) { $hrxa = array(); $hrxa = explode(',', $csv); # print_r($hrxa); #scatter # Scatter array into discrete variable names. $Standby = hexdec($hrxa[0]); $OutputConfigId = hexdec($hrxa[1]) ; $ChargeConfigId = hexdec($hrxa[2]) ; $ACInModelId = hexdec($hrxa[8]) ; $OutputVoltTypeId = hexdec($hrxa[18]) ; $MaxChargeCurr = hexdec($hrxa[34]) ; $BulkChargeVolt = hexdec($hrxa[35]) * 0.1; $FloatChargeVolt = hexdec($hrxa[36]) * 0.1; $BatLowToUtiVolt = hexdec($hrxa[37]) * 0.1; $ACChargeCurr = hexdec($hrxa[38]) ; $BatteryTypeId = hexdec($hrxa[39]) ; $Uti2BatVolt = hexdec($hrxa[95]) * 0.1; #gather & write to table hr $sql = "insert into hr values( '$serial', '$dt' ,$Standby ,'$OutputConfigId' ,'$ChargeConfigId' ,'$ACInModelId' ,'$OutputVoltTypeId' ,$MaxChargeCurr ,$BulkChargeVolt ,$FloatChargeVolt ,$BatLowToUtiVolt ,$ACChargeCurr ,$BatteryTypeId ,$Uti2BatVolt )"; if($debug) echo "\n
$sql \n"; $db->exec($sql); }; print_r($hrxa); function hexdecs($hex) { //http://php.net/manual/en/function.hexdec.php#97172 // ignore non hex characters $hex = preg_replace('/[^0-9A-Fa-f]/', '', $hex); // converted decimal value: $dec = hexdec($hex); // maximum decimal value based on length of hex + 1: // number of bits in hex number is 8 bits for each 2 hex -> max = 2^n // use 'pow(2,n)' since '1 << n' is only for integers and therefore limited to integer size. $max = pow(2, 4 * (strlen($hex) + (strlen($hex) % 2))); // complement = maximum - converted hex: $_dec = $max - $dec; // if dec value is larger than its complement we have a negative value (first bit is set) return $dec > $_dec ? -$_dec : $dec; } ?> exec($sql); # get most recent row from table irx $sql = "select dt, csv from irx where dt = (select max(dt) as dt from irx)"; list($dt, $csv) = $db->query( $sql )->fetchArray(SQLITE3_NUM); $irxa = array(); $irxa = explode(',', $csv); if($debug) print_r($irxa); # Scatter array into discrete variable names. # insert variable names from MODBUS pdf. Keep in seq by regNO $serial = "UKDGBMF010"; $SystemStatusId = hexdec($irxa[0]); $Vpv1 = hexdec($irxa[1]) * 0.1; $Ppv1 = hexdec($irxa[3] . $irxa[4]) * 0.1; $Buck1Cur = hexdec($irxa[7]) * 0.1; $OP_Watt = hexdec($irxa[9] . $irxa[10]) * 0.1; $OP_VA = hexdec($irxa[11] . $irxa[12]) * 0.1; $ACChr_Watt = hexdec($irxa[13] . $irxa[14]) * 0.1; $ACChr_VA = hexdec($irxa[15] . $irxa[16]) * 0.1; $BatVolt = hexdec($irxa[17]) * 0.01; $BatSOC = hexdec($irxa[18]) ; $BusVolt = hexdec($irxa[19]) * 0.1; $GridVolt = hexdec($irxa[20]) * 0.1; $LineFreq = hexdec($irxa[21]) * 0.01; $OutputFreq = hexdec($irxa[22]) * 0.1; $WorkTime = hexdec($irxa[30] . $irxa[31]) * 0.5; #Seconds $AC_InWatt = hexdec($irxa[36] . $irxa[37]) * 0.1; $AC_InVA = hexdec($irxa[38] . $irxa[39]) * 0.1; $Epv1_today = hexdec($irxa[48] . $irxa[49]) * 0.1; $Epv1_total = hexdec($irxa[50] . $irxa[51]) * 0.1; $Eac_chrToday = hexdec($irxa[56] . $irxa[57]) * 0.1; $Eac_chrTotal = hexdec($irxa[58] . $irxa[59]) * 0.1; $Ebat_dischrToday = hexdec($irxa[60] . $irxa[61]) * 0.1; $Ebat_dischrTotal = hexdec($irxa[62] . $irxa[63]) * 0.1; $Eac_dischrToday = hexdec($irxa[64] . $irxa[65]) * 0.1; $Eac_dischrTotal = hexdec($irxa[66] . $irxa[67]) * 0.1; $Bat_Watt = hexdecs($irxa[77] . $irxa[78]) * 0.1; #signed 32bit word $Eop_dischrToday = hexdec($irxa[85] . $irxa[86]) * 0.1; $Eop_dischrTotal = hexdec($irxa[87] . $irxa[88]) * 0.1; # insert variable name. Keep in seq by regNO $sql = "CREATE TABLE if not exists ir ( serial text , dt text , SystemStatusId text --0 , Vpv1 num --1 0.1V , Ppv1 num --3,4 0.1W , Buck1Cur num --7 0.1A , OP_Watt num --9 0.1W , OP_VA num --11 0.1VA , ACChr_Watt num --13 0.1VA , ACChr_VA num --15 0.1VA , BatVolt num --17 , BatSOC num --18 % , BusVolt num --19 0.1V , GridVolt num --20 0.1V , LineFreq num --21 0.01Hz , OutputFreq num --23 , WorkTime num --30,31 , AC_InWatt num --36-37 0.1W , AC_InVA num --38-39 0.1W , Epv1_today num --48,49 0.1kWh , Epv1_total num --50,51 0.1kWh , Eac_chrToday num --56-57 0.1kWh , Eac_chrTotal num --58-59 0.1kWh , Ebat_dischrToday num --60,61 0.1kWh , Ebat_dischrTotal num --62,63 0.1kWh , Eac_dischrToday num --64-65 0.1kWh , Eac_dischrTotal num --66-67 0.1kWh , Bat_Watt num --77 0.1W , Eop_dischrToday num --85-86 0.1kWh , Eop_dischrTotal num --87-88 0.1kWh , PRIMARY KEY(serial, dt) )"; if($debug) echo "\n
$sql \n"; $db->exec($sql); # insert data into table ir. Keep variable names in seq by regNO $sql = "insert or ignore into ir values( '$serial', '$dt', '$SystemStatusId', $Vpv1, $Ppv1, $Buck1Cur, $OP_Watt, $OP_VA, $ACChr_Watt, $ACChr_VA, $BatVolt, $BatSOC, $BusVolt, $GridVolt, $LineFreq, $OutputFreq, $WorkTime, $AC_InWatt, $AC_InVA, $Epv1_today, $Epv1_total, $Eac_chrToday, $Eac_chrTotal, $Ebat_dischrToday, $Ebat_dischrTotal, $Eac_dischrToday, $Eac_dischrTotal, $Bat_Watt, $Eop_dischrToday, $Eop_dischrTotal )"; if($debug) echo "\n
$sql \n"; $db->exec($sql); function hexdecs($hex) { //http://php.net/manual/en/function.hexdec.php#97172 // ignore non hex characters $hex = preg_replace('/[^0-9A-Fa-f]/', '', $hex); // converted decimal value: $dec = hexdec($hex); // maximum decimal value based on length of hex + 1: // number of bits in hex number is 8 bits for each 2 hex -> max = 2^n // use 'pow(2,n)' since '1 << n' is only for integers and therefore limited to integer size. $max = pow(2, 4 * (strlen($hex) + (strlen($hex) % 2))); // complement = maximum - converted hex: $_dec = $max - $dec; // if dec value is larger than its complement we have a negative value (first bit is set) return $dec > $_dec ? -$_dec : $dec; } ?> deviceInit('/dev/ttyGW',9600,'none',8,2,'none'); //print_r($modbus); //sleep(9); // Open port $modbus->deviceOpen(); //print_r($modbus); //sleep(9); # read registers 0-162 $regnos = array(); #Register Numbers 0-162 $startingaddress = str_pad(dechex(34), 4, "0", STR_PAD_LEFT); //echo "\n$startingaddress\n"; $Numberofpoints = str_pad(dechex(15), 4, "0", STR_PAD_LEFT); //echo "\n$Numberofpoints\n"; $result=$modbus->sendQuery(1,3,"$startingaddress", 1); print_r($result); $currentChargeMax = $result[0]*256+$result[1]; echo "Maximum Charge Current = $currentChargeMax\n"; $modbus->deviceClose(); ?> deviceInit('/dev/ttyGW',9600,'none',8,2,'none'); // Open port $modbus->deviceOpen(); // Enable debug $modbus->debug = $debug; #@# do stuff # fetch one word beginning at hr 01 to display new contents $new=$modbus->sendQuery(1,3,"0026", 2); if($debug) print_r($new); # fetch one word beginning at hr 01 and display existing contents $old=$modbus->sendQuery(1,6,"0026","0002",2); if($debug) print_r($old); sleep(3); # write single word(value=2) to hr 01 #$result=$modbus->sendQuery(1,6,95, 1); #if($debug) print_r($result); # fetch one word beginning at hr 01 to display new contents $last=$modbus->sendQuery(1,3,"0026", 2); if($debug) print_r($last); if($debug) echo "
Do you see a value of 2 here and 'Utl' on GW blue screen? If yes, then success!/n"; echo "\n"; ?> must use the correct/dev/ USBx <========================= $modbus->deviceInit('/dev/ttyGW',9600,'none',8,2,'none'); // Open port $modbus->deviceOpen(); // Enable debug $modbus->debug = $debug; # page 6 $fv = 100 * 2**-15; $fv16 = 100 * 2**-16; #ev_tempcomp $fa = 79.16 * 2**-15; #bank 2 # Ev_reg2 = ABS $ev_reg2 = dechex(13.301/$fv); #ABS keep below AIO CC echo "\n
Ev_reg2= $ev_reg2"; $result=$modbus->sendQuery(1,6,"e00d","$ev_reg2"); # Ev_float2 $data = dechex(0); #Cancel Float $data = dechex(12.801/$fv); # Resting Voltage; keep way below AIO CV if($debug) echo "\n
data=$data\n"; $result=$modbus->sendQuery(1,6,"e00e","$data"); # Et_float2 [57360][0xE00F](seconds) time before entering float, bank 2 //Calculate Et_float2 [57360][0xE00F](seconds) time before entering float, bank 2. $data = dechex(900); if($debug) echo "\n
et_float2, hex=$data"; $result=$modbus->sendQuery(1,6,"e00f","$data"); # Et_floatlb2 [57361][0xE010](seconds) time before entering float due to low battery, bank 2 $data = dechex(0); #$data = dechex(7200); if($debug) echo "\n
Et_floatlb2=0 data=$data"; $result=$modbus->sendQuery(1,6,"e010","$data"); # Ev_floatlb_trip2 #$data = dechex(12.2/$fv); $data = dechex(0); if($debug) echo "\n
0 data=$data"; $result=$modbus->sendQuery(1,6,"e011","$data"); # Ev_float_cancel2 $data = dechex(0); if($debug) echo "\n
0 data=$data"; $result=$modbus->sendQuery(1,6,"e012","$data"); # Et_float_exit_cum2 $data = dechex(0); #0 = disable RE-BULK time delay if($debug) echo "\n
0 data=$data"; $result=$modbus->sendQuery(1,6,"e013","$data"); $dec = 8;#limit charging Current. Max is 15A for scc14 $hex = dechex($dec/$fa); if($debug) echo "\n
$dec, $fa, $hex"; $result=$modbus->sendQuery(1,6,"e038","$hex"); #$data = dechex(0.03/$fv16); #default ev_tempcomp. $data = dechex(0.03/$fv16); #cancel when charging LFP if($debug) echo "\n
eo1a=$data"; $result=$modbus->sendQuery(1,6,"e01a","$data"); #reset============================================================================== if($debug) echo "\n
//reset control 0x00ff\n"; $result=$modbus->sendQuery(1,5,"00ff","ff00"); #Read the settings and write them to table========================================== #serial number $result=$modbus->sendQuery(1,4,"f000",4); if($debug) echo "\n
"; if($debug) print_r($result); $serial = chr(hexdec($result[1])) . chr(hexdec($result[0])) . chr(hexdec($result[3])) . chr(hexdec($result[2])) . chr(hexdec($result[5])) . chr(hexdec($result[4])) . chr(hexdec($result[7])) . chr(hexdec($result[6])) ; if($debug) echo "\n
USB0:serial = $serial\n"; //assign values. see page 5 of pdf $fa = 79.16 * 2**-15; $fv16 = 100 * 2**-16; $f1 = 2**-15; $f2 = 96.667 * $f1; $f3 = 139.15 * $f1; $f4 = 66.667 * $f1; $f5 = 316.67 * $f1; if($debug) echo "\n
$f1, $f2, $f3, $f4, $f5"; #/////////////////////bank 1 $result=$modbus->sendQuery(1,4,"e000",2); if($debug) echo "\n
"; if($debug) print_r($result); $ev_reg1 = hexdec($result[0] . $result[1]) * 100 * $f1; // 0xe00d $ev_float1 = hexdec($result[2] . $result[3]) * 100 * $f1; // 0xe00e #/////////////////////bank 2 $result=$modbus->sendQuery(1,4,"e00d",7); if($debug) echo "\n
"; if($debug) print_r($result); $ev_reg2 = hexdec($result[0] . $result[1]) * 100 * $f1; // 0xe00d $ev_float2 = hexdec($result[2] . $result[3]) * 100 * $f1; // 0xe00e $et_float2 = hexdec($result[4] . $result[5]) ; // 0xe00f $et_floatlb2 = hexdec($result[6] . $result[7]) ; // 0xe010 $ev_floatlb_trip2 = hexdec($result[8] . $result[9]) * 100 * $f1; // 0xe011 $ev_float_cancel2 = hexdec($result[10] . $result[11]) * 100 * $f1; // 0xe012 $et_float_exit_cum2 = hexdec($result[12] . $result[13]); // 0xe013 #ev_tempcomp. $result=$modbus->sendQuery(1,4,"e01a",1); if($debug) echo "\n
"; if($debug) print_r($result); $ev_tempcomp = hexdec($result[0] . $result[1]) * $fv16; // 0xe01a if($debug) echo "\n
eic_lim=$ev_tempcomp"; #Eic _lim [57401][0xE038](A). Charge current limit. $result=$modbus->sendQuery(1,4,"e038",1); $eic_lim = hexdec($result[0] . $result[1]) * $fa; // 0xe038 if($debug) echo "\n
eic_lim=$eic_lim"; $db = new SQLite3('ramdisk/scc14.db') or die ('Unable to open database'); #list($now) = $db->query( "select datetime('now', 'localtime')" )->fetchArray(SQLITE3_NUM); $sql = "CREATE TABLE if not exists echarge (serial text, dt text, usb text, ev_reg1 num, ev_float1 num, ev_reg2 num, ev_float2 num, et_float2 num, et_floatlb2 num, ev_floatlb_trip2 num, ev_float_cancel2 num, et_float_exit_cum2 num, eic_lim num, ev_tempcomp num, PRIMARY KEY(serial, dt))"; if($debug) echo "\n
$sql \n"; $db->exec($sql); #et_float2, et_floatlb2, ev_floatlb_trip2, ev_float_cancel2, et_float_exit_cum2 $sql = "insert or replace into echarge values('$serial', datetime('now', 'localtime'), 'USB1', $ev_reg1, $ev_float1, $ev_reg2, $ev_float2, $et_float2, $et_floatlb2, $ev_floatlb_trip2, $ev_float_cancel2, $et_float_exit_cum2, $eic_lim, $ev_tempcomp)"; if($debug) echo "\n
$sql \n"; $db->exec($sql); ?> deviceInit('/dev/ttyGW',9600,'none',8,2,'none'); //print_r($modbus); //sleep(9); // Open port $modbus->deviceOpen(); //print_r($modbus); //sleep(9); // Enable debug $modbus->debug = $debug; # read registers 0-162 $regnos = array(); #Register Numbers 0-162 $startingaddress = str_pad(dechex(0), 4, "0", STR_PAD_LEFT); echo "\n$startingaddress\n"; $Numberofpoints = str_pad(dechex(15), 4, "0", STR_PAD_LEFT); echo "\n$Numberofpoints\n"; $result=$modbus->sendQuery(1,3,"$startingaddress", 15); if($debug) print_r($result); //print ("1,3,$startingaddress,15"); //print_r($result); //sleep(9); for($i=0; $i < 30; $i+=2) { $j = $i+1; #echo 'i', 'j', $i, $j, 'Word', $result[$i] . $result[$j], chr(10); $regnos[] = $result[$i] . $result[$j]; } #sleep(1); $startingaddress = str_pad(dechex(15), 4, "0", STR_PAD_LEFT); echo "\n$startingaddress\n"; $Numberofpoints = str_pad(dechex(15), 4, "0", STR_PAD_LEFT); echo "\n$Numberofpoints\n"; $result=$modbus->sendQuery(1,3,"$startingaddress", 15); if($debug) print_r($result); for($i=0; $i < 30; $i+=2) { $j = $i+1; #echo 'i', 'j', $i, $j, 'Word', $result[$i] . $result[$j], chr(10); $regnos[] = $result[$i] . $result[$j]; } #sleep(1); $startingaddress = str_pad(dechex(30), 4, "0", STR_PAD_LEFT); echo "\n$startingaddress\n"; $Numberofpoints = str_pad(dechex(15), 4, "0", STR_PAD_LEFT); echo "\n$Numberofpoints\n"; $result=$modbus->sendQuery(1,3,"$startingaddress", 15); if($debug) print_r($result); for($i=0; $i < 30; $i+=2) { $j = $i+1; #echo 'i', 'j', $i, $j, 'Word', $result[$i] . $result[$j], chr(10); $regnos[] = $result[$i] . $result[$j]; } #sleep(1); $startingaddress = str_pad(dechex(45), 4, "0", STR_PAD_LEFT); echo "\n$startingaddress\n"; $Numberofpoints = str_pad(dechex(15), 4, "0", STR_PAD_LEFT); echo "\n$Numberofpoints\n"; $result=$modbus->sendQuery(1,3,"$startingaddress", 15); if($debug) print_r($result); for($i=0; $i < 30; $i+=2) { $j = $i+1; #echo 'i', 'j', $i, $j, 'Word', $result[$i] . $result[$j], chr(10); $regnos[] = $result[$i] . $result[$j]; } #sleep(1); $startingaddress = str_pad(dechex(60), 4, "0", STR_PAD_LEFT); echo "\n$startingaddress\n"; $Numberofpoints = str_pad(dechex(15), 4, "0", STR_PAD_LEFT); echo "\n$Numberofpoints\n"; $result=$modbus->sendQuery(1,3,"$startingaddress", 15); if($debug) print_r($result); for($i=0; $i < 30; $i+=2) { $j = $i+1; #echo 'i', 'j', $i, $j, 'Word', $result[$i] . $result[$j], chr(10); $regnos[] = $result[$i] . $result[$j]; } #sleep(1); $startingaddress = str_pad(dechex(75), 4, "0", STR_PAD_LEFT); echo "\n$startingaddress\n"; $Numberofpoints = str_pad(dechex(15), 4, "0", STR_PAD_LEFT); echo "\n$Numberofpoints\n"; $result=$modbus->sendQuery(1,3,"$startingaddress", 15); if($debug) print_r($result); for($i=0; $i < 30; $i+=2) { $j = $i+1; #echo 'i', 'j', $i, $j, 'Word', $result[$i] . $result[$j], chr(10); $regnos[] = $result[$i] . $result[$j]; } #sleep(1); $startingaddress = str_pad(dechex(90), 4, "0", STR_PAD_LEFT); echo "\n$startingaddress\n"; $Numberofpoints = str_pad(dechex(15), 4, "0", STR_PAD_LEFT); echo "\n$Numberofpoints\n"; $result=$modbus->sendQuery(1,3,"$startingaddress", 15); if($debug) print_r($result); for($i=0; $i < 30; $i+=2) { $j = $i+1; #echo 'i', 'j', $i, $j, 'Word', $result[$i] . $result[$j], chr(10); $regnos[] = $result[$i] . $result[$j]; } #sleep(1); $startingaddress = str_pad(dechex(105), 4, "0", STR_PAD_LEFT); echo "\n$startingaddress\n"; $Numberofpoints = str_pad(dechex(15), 4, "0", STR_PAD_LEFT); echo "\n$Numberofpoints\n"; $result=$modbus->sendQuery(1,3,"$startingaddress", 15); if($debug) print_r($result); for($i=0; $i < 30; $i+=2) { $j = $i+1; #echo 'i', 'j', $i, $j, 'Word', $result[$i] . $result[$j], chr(10); $regnos[] = $result[$i] . $result[$j]; } #sleep(1); $startingaddress = str_pad(dechex(120), 4, "0", STR_PAD_LEFT); echo "\n$startingaddress\n"; $Numberofpoints = str_pad(dechex(15), 4, "0", STR_PAD_LEFT); echo "\n$Numberofpoints\n"; $result=$modbus->sendQuery(1,3,"$startingaddress", 15); if($debug) print_r($result); for($i=0; $i < 30; $i+=2) { $j = $i+1; #echo 'i', 'j', $i, $j, 'Word', $result[$i] . $result[$j], chr(10); $regnos[] = $result[$i] . $result[$j]; } #sleep(1); $startingaddress = str_pad(dechex(135), 4, "0", STR_PAD_LEFT); echo "\n$startingaddress\n"; $Numberofpoints = str_pad(dechex(15), 4, "0", STR_PAD_LEFT); echo "\n$Numberofpoints\n"; $result=$modbus->sendQuery(1,3,"$startingaddress", 15); if($debug) print_r($result); for($i=0; $i < 30; $i+=2) { $j = $i+1; #echo 'i', 'j', $i, $j, 'Word', $result[$i] . $result[$j], chr(10); $regnos[] = $result[$i] . $result[$j]; } /* #sleep(1); $startingaddress = str_pad(dechex(150), 4, "0", STR_PAD_LEFT); echo "\n$startingaddress\n"; $Numberofpoints = str_pad(dechex(15), 4, "0", STR_PAD_LEFT); echo "\n$Numberofpoints\n"; $result=$modbus->sendQuery(1,3,"$startingaddress", 15); if($debug) print_r($result); $rc = count($result); echo "\n $rc \n"; for($i=0; $i < 30; $i+=2) { $j = $i+1; #echo 'i', 'j', $i, $j, 'Word', $result[$i] . $result[$j], chr(10); $regnos[] = $result[$i] . $result[$j]; } */ #print_r($regnos);var_dump(implode(",", $regnos)); $hrx = implode(",", $regnos); print_r($regnos); var_dump($hrx); # store this $db = new SQLite3('ramdisk/aiox.db') or die ('Unable to open database'); $sql = "PRAGMA busy_timeout=20000"; $db->exec($sql); #list($now) = $db->query( "select datetime('now', 'localtime')" )->fetchArray(SQLITE3_NUM); $sql = "CREATE TABLE if not exists hrx (serial text, dt text, csv text, PRIMARY KEY(serial, dt))"; if($debug) echo "\n
$sql \n"; $db->exec($sql); #et_float2, et_floatlb2, ev_floatlb_trip2, ev_float_cancel2, et_float_exit_cum2 $sql = "insert or replace into hrx values('UKDGBMF010', datetime('now', 'localtime'), '$hrx')"; #if($debug) echo "\n
$sql \n"; $db->exec($sql); ?> deviceInit('/dev/ttyGW',9600,'none',8,2,'none'); // Open port $modbus->deviceOpen(); // Enable debug $modbus->debug = $debug; # read registers 0-224 in groups of 15 $regnos = array(); #Register Numbers 0-224 #0 to 14 $startingaddress = str_pad(dechex(0), 4, "0", STR_PAD_LEFT); echo "\n$startingaddress\n"; $Numberofpoints = str_pad(dechex(15), 4, "0", STR_PAD_LEFT); echo "\n$Numberofpoints\n"; $result=$modbus->sendQuery(1,4,"$startingaddress", 15); if($debug) print_r($result); for($i=0; $i < 30; $i+=2) { $j = $i+1; #echo 'i', 'j', $i, $j, 'Word', $result[$i] . $result[$j], chr(10); $regnos[] = $result[$i] . $result[$j]; } #sleep(1); $startingaddress = str_pad(dechex(15), 4, "0", STR_PAD_LEFT); echo "\n$startingaddress\n"; $Numberofpoints = str_pad(dechex(15), 4, "0", STR_PAD_LEFT); echo "\n$Numberofpoints\n"; $result=$modbus->sendQuery(1,4,"$startingaddress", 15); if($debug) print_r($result); for($i=0; $i < 30; $i+=2) { $j = $i+1; #echo 'i', 'j', $i, $j, 'Word', $result[$i] . $result[$j], chr(10); $regnos[] = $result[$i] . $result[$j]; } #sleep(1); $startingaddress = str_pad(dechex(30), 4, "0", STR_PAD_LEFT); echo "\n$startingaddress\n"; $Numberofpoints = str_pad(dechex(15), 4, "0", STR_PAD_LEFT); echo "\n$Numberofpoints\n"; $result=$modbus->sendQuery(1,4,"$startingaddress", 15); if($debug) print_r($result); for($i=0; $i < 30; $i+=2) { $j = $i+1; #echo 'i', 'j', $i, $j, 'Word', $result[$i] . $result[$j], chr(10); $regnos[] = $result[$i] . $result[$j]; } #sleep(1); $startingaddress = str_pad(dechex(45), 4, "0", STR_PAD_LEFT); echo "\n$startingaddress\n"; $Numberofpoints = str_pad(dechex(15), 4, "0", STR_PAD_LEFT); echo "\n$Numberofpoints\n"; $result=$modbus->sendQuery(1,4,"$startingaddress", 15); if($debug) print_r($result); for($i=0; $i < 30; $i+=2) { $j = $i+1; #echo 'i', 'j', $i, $j, 'Word', $result[$i] . $result[$j], chr(10); $regnos[] = $result[$i] . $result[$j]; } #sleep(1); $startingaddress = str_pad(dechex(60), 4, "0", STR_PAD_LEFT); echo "\n$startingaddress\n"; $Numberofpoints = str_pad(dechex(15), 4, "0", STR_PAD_LEFT); echo "\n$Numberofpoints\n"; $result=$modbus->sendQuery(1,4,"$startingaddress", 15); if($debug) print_r($result); for($i=0; $i < 30; $i+=2) { $j = $i+1; #echo 'i', 'j', $i, $j, 'Word', $result[$i] . $result[$j], chr(10); $regnos[] = $result[$i] . $result[$j]; } #sleep(1); $startingaddress = str_pad(dechex(75), 4, "0", STR_PAD_LEFT); echo "\n$startingaddress\n"; $Numberofpoints = str_pad(dechex(15), 4, "0", STR_PAD_LEFT); echo "\n$Numberofpoints\n"; $result=$modbus->sendQuery(1,4,"$startingaddress", 15); if($debug) print_r($result); for($i=0; $i < 30; $i+=2) { $j = $i+1; #echo 'i', 'j', $i, $j, 'Word', $result[$i] . $result[$j], chr(10); $regnos[] = $result[$i] . $result[$j]; } #sleep(1); $startingaddress = str_pad(dechex(90), 4, "0", STR_PAD_LEFT); echo "\n$startingaddress\n"; $Numberofpoints = str_pad(dechex(15), 4, "0", STR_PAD_LEFT); echo "\n$Numberofpoints\n"; $result=$modbus->sendQuery(1,4,"$startingaddress", 15); if($debug) print_r($result); for($i=0; $i < 30; $i+=2) { $j = $i+1; #echo 'i', 'j', $i, $j, 'Word', $result[$i] . $result[$j], chr(10); $regnos[] = $result[$i] . $result[$j]; } #sleep(1); $startingaddress = str_pad(dechex(105), 4, "0", STR_PAD_LEFT); echo "\n$startingaddress\n"; $Numberofpoints = str_pad(dechex(15), 4, "0", STR_PAD_LEFT); echo "\n$Numberofpoints\n"; $result=$modbus->sendQuery(1,4,"$startingaddress", 15); if($debug) print_r($result); for($i=0; $i < 30; $i+=2) { $j = $i+1; #echo 'i', 'j', $i, $j, 'Word', $result[$i] . $result[$j], chr(10); $regnos[] = $result[$i] . $result[$j]; } #sleep(1); $startingaddress = str_pad(dechex(120), 4, "0", STR_PAD_LEFT); echo "\n$startingaddress\n"; $Numberofpoints = str_pad(dechex(15), 4, "0", STR_PAD_LEFT); echo "\n$Numberofpoints\n"; $result=$modbus->sendQuery(1,4,"$startingaddress", 15); if($debug) print_r($result); for($i=0; $i < 30; $i+=2) { $j = $i+1; #echo 'i', 'j', $i, $j, 'Word', $result[$i] . $result[$j], chr(10); $regnos[] = $result[$i] . $result[$j]; } #sleep(1); $startingaddress = str_pad(dechex(135), 4, "0", STR_PAD_LEFT); echo "\n$startingaddress\n"; $Numberofpoints = str_pad(dechex(15), 4, "0", STR_PAD_LEFT); echo "\n$Numberofpoints\n"; $result=$modbus->sendQuery(1,4,"$startingaddress", 15); if($debug) print_r($result); for($i=0; $i < 30; $i+=2) { $j = $i+1; #echo 'i', 'j', $i, $j, 'Word', $result[$i] . $result[$j], chr(10); $regnos[] = $result[$i] . $result[$j]; } #sleep(1); $startingaddress = str_pad(dechex(150), 4, "0", STR_PAD_LEFT); echo "\n$startingaddress\n"; $Numberofpoints = str_pad(dechex(15), 4, "0", STR_PAD_LEFT); echo "\n$Numberofpoints\n"; $result=$modbus->sendQuery(1,4,"$startingaddress", 15); if($debug) print_r($result); for($i=0; $i < 30; $i+=2) { $j = $i+1; #echo 'i', 'j', $i, $j, 'Word', $result[$i] . $result[$j], chr(10); $regnos[] = $result[$i] . $result[$j]; } #sleep(1); $startingaddress = str_pad(dechex(165), 4, "0", STR_PAD_LEFT); echo "\n$startingaddress\n"; $Numberofpoints = str_pad(dechex(15), 4, "0", STR_PAD_LEFT); echo "\n$Numberofpoints\n"; $result=$modbus->sendQuery(1,4,"$startingaddress", 15); if($debug) print_r($result); for($i=0; $i < 30; $i+=2) { $j = $i+1; #echo 'i', 'j', $i, $j, 'Word', $result[$i] . $result[$j], chr(10); $regnos[] = $result[$i] . $result[$j]; } #sleep(1); $startingaddress = str_pad(dechex(180), 4, "0", STR_PAD_LEFT); echo "\n$startingaddress\n"; $Numberofpoints = str_pad(dechex(15), 4, "0", STR_PAD_LEFT); echo "\n$Numberofpoints\n"; $result=$modbus->sendQuery(1,4,"$startingaddress", 15); if($debug) print_r($result); for($i=0; $i < 30; $i+=2) { $j = $i+1; #echo 'i', 'j', $i, $j, 'Word', $result[$i] . $result[$j], chr(10); $regnos[] = $result[$i] . $result[$j]; } #sleep(1); $startingaddress = str_pad(dechex(195), 4, "0", STR_PAD_LEFT); echo "\n$startingaddress\n"; $Numberofpoints = str_pad(dechex(15), 4, "0", STR_PAD_LEFT); echo "\n$Numberofpoints\n"; $result=$modbus->sendQuery(1,4,"$startingaddress", 15); if($debug) print_r($result); for($i=0; $i < 30; $i+=2) { $j = $i+1; #echo 'i', 'j', $i, $j, 'Word', $result[$i] . $result[$j], chr(10); $regnos[] = $result[$i] . $result[$j]; } #sleep(1); $startingaddress = str_pad(dechex(210), 4, "0", STR_PAD_LEFT); echo "\n$startingaddress\n"; $Numberofpoints = str_pad(dechex(15), 4, "0", STR_PAD_LEFT); echo "\n$Numberofpoints\n"; $result=$modbus->sendQuery(1,4,"$startingaddress", 15); if($debug) print_r($result); for($i=0; $i < 30; $i+=2) { $j = $i+1; #echo 'i', 'j', $i, $j, 'Word', $result[$i] . $result[$j], chr(10); $regnos[] = $result[$i] . $result[$j]; } if($debug) print_r($regnos); $irx = implode(",", $regnos); var_dump($irx); # store this $db = new SQLite3('ramdisk/aiox.db') or die ('Unable to open database'); #list($now) = $db->query( "select datetime('now', 'localtime')" )->fetchArray(SQLITE3_NUM); $sql = "CREATE TABLE if not exists irx (serial text, dt text, csv text, PRIMARY KEY(serial, dt))"; if($debug) echo "\n
$sql \n"; $db->exec($sql); #et_float2, et_floatlb2, ev_floatlb_trip2, ev_float_cancel2, et_float_exit_cum2 $sql = "insert or replace into irx values('UKDGBMF010', datetime('now', 'localtime'), '$irx')"; if($debug) echo "\n
$sql \n"; $db->exec($sql); ?> deviceInit('/dev/ttyGW',9600,'none',8,2,'none'); print_r($modbus); sleep (9); // Open port $modbus->deviceOpen(); print_r($modbus); sleep (9); // Enable debug $modbus->debug = $debug; print_r($modbus); sleep (9); # read registers 0-224 in groups of 15 $regnos = array(); #Register Numbers 0-224 #0 to 14 $startingaddress = str_pad(dechex(0), 4, "0", STR_PAD_LEFT); echo "\n$startingaddress\n"; $Numberofpoints = str_pad(dechex(15), 4, "0", STR_PAD_LEFT); echo "\n$Numberofpoints\n"; $result=$modbus->sendQuery(1,4,"$startingaddress", 15); if($debug) print_r($result); for($i=0; $i < 30; $i+=2) { $j = $i+1; #echo 'i', 'j', $i, $j, 'Word', $result[$i] . $result[$j], chr(10); $regnos[] = $result[$i] . $result[$j]; } if($debug) print_r($regnos); sleep (9); $irx = implode(",", $regnos); var_dump($irx); # store this $db = new SQLite3('ramdisk/aiox.db') or die ('Unable to open database'); sleep (9); #list($now) = $db->query( "select datetime('now', 'localtime')" )->fetchArray(SQLITE3_NUM); $sql = "CREATE TABLE if not exists irx (serial text, dt text, csv text, PRIMARY KEY(serial, dt))"; if($debug) echo "\n
$sql \n"; $db->exec($sql); #et_float2, et_floatlb2, ev_floatlb_trip2, ev_float_cancel2, et_float_exit_cum2 $sql = "insert or replace into irx values('UKDGBMF010', datetime('now', 'localtime'), '$irx')"; if($debug) echo "\n
$sql \n"; $db->exec($sql); ?> deviceInit('/dev/ttyUSB0',9600,'none',8,2,'none'); $modbus->deviceInit('/dev/ttyGW',9600,'none',8,2,'none'); // Open port $modbus->deviceOpen(); // Enable debug $modbus->debug = $debug; # read registers 0-162 $regnos = array(); $result=$modbus->sendQuery(1,3,1, 1); if($debug) print_r($result); ?> deviceInit($serialdevice,9600,'none',8,2,'none'); // Open port $modbus->deviceOpen(); // Enable debug $modbus->debug = $debug; #@# do stuff # fetch hr 01 and display existing contents $old=$modbus->sendQuery(1,3,1, 1); if($debug) print_r($old); # write hr 01 to 2=Utl $result=$modbus->sendQuery(1,6,2, 1); if($debug) print_r($result); # fetch hr 01 and display existing contents $new=$modbus->sendQuery(1,3,1, 1); if($debug) print_r($new); if($debug) echo "
Do you see a value of 2 here and 'Utl' on GW blue screen?/n"; echo ""; ?> deviceInit('/dev/ttyGW',9600,'none',8,2,'none'); // Open port $modbus->deviceOpen(); // Enable debug $modbus->debug = $debug; #@# do stuff # fetch one word beginning at hr 01 and display existing contents $old=$modbus->sendQuery(1,3,1, 1); if($debug) print_r($old); # write single word(value=2) to hr 01 $result=$modbus->sendQuery(1,6,1, 2); if($debug) print_r($result); # fetch one word beginning at hr 01 to display new contents $new=$modbus->sendQuery(1,3,2, 1); if($debug) print_r($new); if($debug) echo "
Do you see a value of 2 here and 'Utl' on GW blue screen? If yes, then success!/n"; echo ""; ?> deviceInit('/dev/ttyGW',115200,'none',8,1,'none'); $modbus->deviceOpen(); $result=$modbus->sendQuery(1,4,"310C",3); print_r($result); print "\nVoltage: ".(hexdec($result[0].$result[1])/100); $modbus->deviceClose(); ?> deviceInit('/dev/ttyUSB0',115200,'none',8,1,'none'); $modbus->deviceOpen(); $result=$modbus->sendQuery(1,4,"310C",3); print_r($result); print "\nVoltage: ".(hexdec($result[0].$result[1])/100); $modbus->deviceClose(); ?> exec(""); $db->exec("attach database '/var/www/html/AIO/ramdisk/aiox.db' as ram"); #$db->exec("attach database '/var/www/html/AIO//aiox.db' as ssd"); $db->loadExtension('libsqlitefunctions.so'); $sql = "PRAGMA busy_timeout=6000"; #get today's as-of dt for title $sql = "select max(date(dt, '-30 day')), max(dt) from ir " ; if($debug) echo "\n$sql"; list($dtfrom, $dtasof) = $db->query($sql)->fetchArray(SQLITE3_NUM); if($debug) echo "\n$dtfrom, $dtasof"; $data = array(); #$sql = "select strftime('%d',dt), Epv1_today, Eac_chrToday + Eac_dischrToday, Eop_dischrToday, Ebat_dischrToday from (select * from ssd.ir) as u join (select max(dt) as dt from ssd.ir group by date(dt) order by dt desc limit 30) using (dt) order by dt"; $sql = "select strftime('%d',ir.dt), max(Epv1_today), max(Eac_chrToday + Eac_dischrToday), max(Eop_dischrToday), max(Ebat_dischrToday) from ir, (select max(dt) as dt from ir where dt > '$dtfrom' and systemstatusid in('8', '12') group by date(dt)) as s where date(ir.dt) = date(s.dt) and ir.dt > s.dt group by date(ir.dt) " ; if($debug) echo "\n$sql"; $qr = $db->query($sql); while($row = $qr->fetchArray(SQLITE3_NUM)) { $data[] = $row; if($debug) echo'.'; } if($debug) print_r($data); $plot = new PHPlot(800, 400); $plot->SetImageBorderType('plain'); $plot->SetMarginsPixels(56, 56); $plot->SetLightGridColor('black'); $plot->SetPlotType('linepoints'); $plot->SetDataType('text-data'); $plot->SetDataValues($data); # Main plot title: $plot->SetTitle("GW kWhs ramdisk From:$dtfrom - To:$dtasof"); $plot->SetXTitle('Day of Month'); # Set Y data limits, tick increment, and titles: $plot->SetPlotAreaWorld(NULL, 0, NULL, NULL); $plot->SetYTickIncrement(.2); $plot->SetYTitle('kWhs','plotright'); $plot->SetYTickPos('plotright'); $plot->SetYTickLabelPos('plotright'); # Colors are significant to this data: $plot->SetDataColors(array('gold', 'navy', 'red', 'maroon')); #$plot->SetPlotBgColor('grey'); $plot->SetDrawPlotAreaBackground(True); $plot->SetLegend(array('Solar->', 'Grid->', '->Load', '->Battery')); $plot->SetLegendPixels(400, 25); $plot->SetLegendUseShapes(true); #false = boxes or true = shapes # Turn off X tick labels and ticks because they don't apply here: $plot->SetXTickLabelPos('none'); $plot->SetXTickPos('none'); if(!$debug) $plot->DrawGraph(); ?>
See also battery voltage history and solar panel wattage history and Solar panel kilowatthour history.
Read Input Registers
";
echo "\n";
$air = array('Standby','PV and Grid Combined Discharge','Discharge','Fault','Flash','PV charge','AC charge','Combine charge','Combine charge and Bypass','PV charge and Bypass','AC charge and Bypass','Bypass','PV charge and Discharge');
//for($i=0; $i < 13; $i++) {  echo "$i $air[$i]\n"; };
for($i=0; $i < 32; $i+=2) {
    $j = $i+1;
    $register = str_pad($i,3," ", STR_PAD_LEFT);
    $register = $register/2;
    $hex = $result[$i].$result[$j];
    $dec = hexdec($hex);
    $dectenth = $dec/10;
    if ($i<19) echo " ",$register," ", 'hex Word ', $hex;
    if ($i>18)  echo $register," ", 'hex Word ', $hex;
    if ($register==0) echo "\tGrowatt output 0000=enabled, 0100=disabled";
    if ($register==1) echo "\tAC Output first prioroty 0=Bat 1=PV 2=Uti 3=PV&Uti";
    if ($register==2) echo "\tCharge Source set 0:PV_first 1:PV&Uti 2:PV_Only";
#    if ($register==3) echo "\tPV1 Power high";
#    if ($register==4) echo "\tPV1 Power $dectenth watts";
#    if ($register==5) echo "\tPV1 x6553.6";
#    if ($register==6) echo "\tPV2 N/A";
#    if ($register==7) echo "\tBuck1 current $dectenth Amperes";
    if ($register==8) echo "\tAC Input Mode VAC 0:APL_90-140 1:UPS_65-140 2:Generator";
    if ($register==9) echo "\tFirmware version High";
    if ($register==10) echo "\tFirmware version Mid";
    if ($register==11) echo "\tFirmware version Low";
    if ($register==12) echo "\tControl Firmware version High";
    if ($register==13) echo "\tControl Firmware version Mid";
    if ($register==14) echo "\tControl Firmware version Low";
    if ($register==15) echo "\tLCD Language";
    if ($register==16) echo "\tGridV_Adj";
    echo chr(10);
    $regnos[] = $result[$i] . $result[$j];
}
echo "
\n";
$modbus->deviceClose();
?>
deviceInit('/dev/ttyUSB0',19200,'none',8,1,'none');
print_r($modbus);
// Open port
$modbus->deviceOpen();
print_r($modbus);
// Close device
$modbus->deviceClose();
print_r($modbus);
?>
* @author Miguel de Benito Delgado (co-author and maintainer, 2003-2005)
* @author Afan Ottenheimer (original author)
*/
/*
* This is free software; you can redistribute it and/or
* modify it under the terms of the GNU Lesser General Public
* License as published by the Free Software Foundation;
* version 2.1 of the License.
*
* This software is distributed in the hope that it will be useful,
* but WITHOUT ANY WARRANTY; without even the implied warranty of
* MERCHANTABILITY or FITNESS FOR A PARTICULAR PURPOSE. See the GNU
* Lesser General Public License for more details.
*
* You should have received a copy of the GNU Lesser General Public
* License along with this software; if not, write to the Free Software
* Foundation, Inc., 51 Franklin Street, Fifth Floor, Boston, MA 02110-1301 USA
* ---------------------------------------------------------------------
*/
/**
* Class for creating a plot
*
* The PHPlot class represents a plot (chart, graph) with all associated
* parameters. This creates a palette (indexed) color image which is limited
* to 256 total colors. For truecolor images (24 bit R, G, B), see the
* PHPlot_truecolor class.
*
* In most cases, methods of PHPlot just change the internal properties, and
* nothing actually happens until the DrawGraph() method is used. Therefore
* methods can be used in any order up until DrawGraph(); the order should not
* affect the results.
*
* Note: Without a background image, the PHPlot class creates a palette
* (indexed) color image, and the PHPlot_truecolor class creates a truecolor
* image. If a background image is used with the constructor of either class,
* the type of image produced matches the type of the background image.
*
*/
class PHPlot
{
/** PHPlot version constant as a string */
const version = '6.2.0';
/** PHPlot version constant as a number = major * 10000 + minor * 100 + patch */
const version_id = 60200;
// All class variables are declared here, and initialized (if applicable).
// Starting with PHPlot-6.0, most variables have 'protected' visibility
// For more information on these variables, see the Reference Manual, Developer's Guide, List
// of Member Variables. The list below is in alphabetical order, matching the manual.
/** Calculated width of bars for bar charts */
protected $actual_bar_width;
/** Calculated bar gap */
protected $bar_adjust_gap;
/** Extra space between groups of bars */
public $bar_extra_space = 0.5;
/** Width of bar relative to space for one bar */
public $bar_width_adjust = 1;
/** Color (R,G,B,A) for image background */
protected $bg_color;
/** Background image filename */
protected $bgimg;
/** Background image tiling mode */
protected $bgmode;
/** Scale factor for box widths in box plots */
public $boxes_frac_width = 0.3;
/** Maximum half-width for boxes in box plots */
public $boxes_max_width = 8;
/** Minimum half-width for boxes in box plots */
public $boxes_min_width = 2;
/** Ratio of the width of the 'T' ends of box plot whiskers to the width of the boxes */
public $boxes_t_width = 0.6;
/** Flag: Don't send cache suppression headers */
protected $browser_cache = FALSE;
/** Max bubble size for bubbles plots */
public $bubbles_max_size;
/** Min bubbles size for bubble plots */
public $bubbles_min_size = 6;
/** Callback (hook) function information, indexed by callback reason */
protected $callbacks = array(
'data_points' => NULL,
'draw_setup' => NULL,
'draw_image_background' => NULL,
'draw_plotarea_background' => NULL,
'draw_titles' => NULL,
'draw_axes' => NULL,
'draw_graph' => NULL,
'draw_border' => NULL,
'draw_legend' => NULL,
'draw_all' => NULL,
'data_color' => NULL,
'debug_textbox' => NULL,
'debug_scale' => NULL,
);
/** Flag: Draw dashed or solid grid lines? */
protected $dashed_grid = TRUE;
/** Initial dashed pattern code */
protected $dashed_style = '2-4';
/** The (converted) data array */
protected $data;
/** Array of colors (R,G,B,A) for data borders available with some plot types */
protected $data_border_colors;
/** Array of colors (R,G,B,A) for data lines/marks/bars/etc. */
protected $data_colors;
/** Maximum number of dependent variable values */
protected $data_columns;
/** Array: Per row maximum Y value */
protected $data_max;
/** Array: Per row minimum Y value */
protected $data_min;
/** Format of the data array */
protected $data_type = 'text-data';
/** Obsolete - suffix for 'data'-formatted labels */
public $data_units_text = '';
/** Angle (in degrees) for data value labels */
public $data_value_label_angle = 90;
/** Distance (in pixels) for data value labels */
public $data_value_label_distance = 5;
/** Color (R,G,B,A) to use for axis data labels */
protected $datalabel_color;
/** Flag: data type has error bars */
protected $datatype_error_bars;
/** Flag: data type has implied X or Y */
protected $datatype_implied;
/** Flag: data type is one-column data for pie chart */
protected $datatype_pie_single;
/** Flag: data type has swapped X and Y values (horizontal plot) */
protected $datatype_swapped_xy;
/** Flag: data type includes Y and Z value pairs */
protected $datatype_yz;
/** Static array of data type information */
static protected $datatypes = array( // See DecodeDataType() and $datatype_* flags
'text-data' => array('implied' => TRUE),
'text-data-single' => array('implied' => TRUE, 'pie_single' => TRUE),
'data-data' => array(),
'data-data-error' => array('error_bars' => TRUE),
'data-data-yx' => array('swapped_xy' => TRUE),
'text-data-yx' => array('implied' => TRUE, 'swapped_xy' => TRUE),
'data-data-xyz' => array('yz' => TRUE),
'data-data-yx-error' => array('swapped_xy' => TRUE, 'error_bars' => TRUE),
);
/** Static array of data type aliases => primary name */
static protected $datatypes_map = array(
'text-linear' => 'text-data',
'linear-linear' => 'data-data',
'linear-linear-error' => 'data-data-error',
'text-data-pie' => 'text-data-single',
'data-data-error-yx' => 'data-data-yx-error',
);
/** Character to use for decimal point in formatted numbers */
protected $decimal_point;
/** The default color array, used to initialize data_colors and error_bar_colors */
protected $default_colors = array(
'SkyBlue', 'green', 'orange', 'blue', 'red', 'DarkGreen', 'purple', 'peru',
'cyan', 'salmon', 'SlateBlue', 'YellowGreen', 'magenta', 'aquamarine1', 'gold', 'violet'
);
/** Dashed-line template, as a string of space-separated markers (see SetDefaultDashedStyle) */
protected $default_dashed_style;
/** Default TrueType font file */
protected $default_ttfont;
/** Array of flags for elements that must be drawn at most once */
protected $done = array();
/** Flag: How to handle missing Y values */
protected $draw_broken_lines = FALSE;
/** Flag: Draw data borders, available with some plot types */
protected $draw_data_borders;
/** Flag: Draw borders on pie chart segments */
protected $draw_pie_borders;
/** Flag: Draw the background of the plot area */
protected $draw_plot_area_background = FALSE;
/** Flag: Draw X data label lines */
protected $draw_x_data_label_lines = FALSE;
/** Flag: Draw X grid lines? */
protected $draw_x_grid;
/** Flag: Draw Y data label lines */
protected $draw_y_data_label_lines = FALSE;
/** Flag: Draw Y grid lines? */
protected $draw_y_grid;
/** Color (R,G,B,A) to use for data value labels */
protected $dvlabel_color;
/** Array of colors (R,G,B,A) for error bars */
protected $error_bar_colors;
/** Thickness of error bar lines */
protected $error_bar_line_width = 1;
/** Shape (style) of error bars: line or tee */
protected $error_bar_shape = 'tee';
/** Size of error bars */
protected $error_bar_size = 5;
/** Image format: png, gif, jpg, wbmp */
protected $file_format = 'png';
/** Array of font information (should be protected, but public for possible callback use) */
public $fonts;
/** Flag: Draw grid on top of or behind the plot */
public $grid_at_foreground = FALSE;
/** Color (R,G,B,A) to use for axes, plot area border, legend border, pie chart lines and text */
protected $grid_color;
/** Controls fraction of bar group space used for bar */
public $group_frac_width = 0.7;
/** Color (R,G,B,A) for image border, if drawn */
protected $i_border;
/** Image border type */
protected $image_border_type = 'none';
/** Width of image border in pixels */
protected $image_border_width;
/** Image height */
protected $image_height;
/** Image width */
protected $image_width;
/** Image resource (should be protected, but public to reduce breakage) */
public $img;
/** Prevent recursion in error message image production */
protected $in_error;
/** Flag: don't send headers */
protected $is_inline = FALSE;
/** Label format info */
protected $label_format = array('x' => array(), 'xd' => array(), 'y' => array(), 'yd' => array());
/** Pie chart label position factor */
protected $label_scale_position = 0.5;
/** Legend text array */
protected $legend;
/** Color (R,G,B,A) for the legend background */
protected $legend_bg_color;
/** Alignment of color boxes or shape markers in the legend: left, right, or none */
protected $legend_colorbox_align = 'right';
/** Color control for colorbox borders in legend */
protected $legend_colorbox_borders = 'textcolor';
/** Adjusts width of color boxes in the legend */
public $legend_colorbox_width = 1;
/** Array holding legend position information */
protected $legend_pos;
/** Flag: reverse the order of lines in the legend box, bottom to top */
protected $legend_reverse_order = FALSE;
/** Legend style setting, left or right */
protected $legend_text_align = 'right';
/** Color (R,G,B,A) for the legend text */
protected $legend_text_color;
/** Draw color boxes (if false or unset) or shape markers (if true) in the legend */
protected $legend_use_shapes = FALSE;
/** Color (R,G,B,A) for grid lines and X data lines */
protected $light_grid_color;
/** Controls inter-line spacing of text */
protected $line_spacing = 4;
/** Plot line style(s) */
protected $line_styles = array('solid', 'solid', 'dashed');
/** Plot line width(s) */
protected $line_widths = 1;
/** Flag to avoid importing locale info */
public $locale_override = FALSE;
/** Overall max X value in the data array */
protected $max_x;
/** Overall max Y value in the data array */
protected $max_y;
/** Overall max Z value in the data array (for X/Y/Z data type only) */
protected $max_z;
/** Overall min X value in the data array */
protected $min_x;
/** Overall min Y value in the data array */
protected $min_y;
/** Overall min Z value in the data array (for X/Y/Z data type only) */
protected $min_z;
/** Color index of image background */
protected $ndx_bg_color;
/** Color index array for data borders */
protected $ndx_data_border_colors;
/** Color index array for plot data lines/marks/bars/etc. */
protected $ndx_data_colors;
/** Color index array for plot data, darker shade */
protected $ndx_data_dark_colors;
/** Color index for axis data labels */
protected $ndx_datalabel_color;
/** Color index for data value labels */
protected $ndx_dvlabel_color;
/** Color index array for error bars */
protected $ndx_error_bar_colors;
/** Color index for axes, plot area border, legend border, pie chart lines and text */
protected $ndx_grid_color;
/** Color index for image border lines */
protected $ndx_i_border;
/** Color index for image border lines, darker shade */
protected $ndx_i_border_dark;
/** Color index for the legend background */
protected $ndx_legend_bg_color;
/** Color index for the legend text */
protected $ndx_legend_text_color;
/** Color index for grid lines and X data lines */
protected $ndx_light_grid_color;
/** Color index for unshaded pie chart segment borders */
protected $ndx_pieborder_color;
/** Color index for pie chart data labels */
protected $ndx_pielabel_color;
/** Color index of plot area background */
protected $ndx_plot_bg_color;
/** Color index for labels and legend text */
protected $ndx_text_color;
/** Color index for tick marks */
protected $ndx_tick_color;
/** Color index for tick labels */
protected $ndx_ticklabel_color;
/** Color index for main title */
protected $ndx_title_color;
/** Color index for X title */
protected $ndx_x_title_color;
/** Color index for Y title */
protected $ndx_y_title_color;
/** Number of rows in the data array (number of points along X, or number of bar groups, for example) */
protected $num_data_rows;
/** Array with number of entries in each data row (including label and X if present) */
protected $num_recs;
/** Forced number of X tick marks */
protected $num_x_ticks = '';
/** Forced number of Y tick marks */
protected $num_y_ticks = '';
/** Scale factor for element widths in OHLC plots. */
public $ohlc_frac_width = 0.3;
/** Maximum half-width for elements in OHLC plots */
public $ohlc_max_width = 8;
/** Minimum half-width for elements in OHLC plots */
public $ohlc_min_width = 2;
/** Redirect to output file */
protected $output_file;
/** Aspect ratio for shaded pie charts */
public $pie_diam_factor = 0.5;
/** Flag: True to draw pie chart segments clockwise, false or unset for counter-clockwise. */
protected $pie_direction_cw = FALSE;
/** Flag: If true, do not include label sizes when calculating pie size. */
protected $pie_full_size = FALSE;
/** Source of label text for pie charts (percent, value, label, or index) */
protected $pie_label_source;
/** Minimum amount of the plot area that will be reserved for the pie */
public $pie_min_size_factor = 0.5;
/** Starting angle in degrees for the first segment in a pie chart */
protected $pie_start_angle = 0;
/** Color (R,G,B,A) to use for unshaded pie chart segment borders */
protected $pieborder_color;
/** Color (R,G,B,A) to use for pie chart data labels */
protected $pielabel_color;
/** Calculated plot area array: ([0],[1]) is top left, ([2],[3]) is bottom right */
protected $plot_area;
/** Height of the plot area */
protected $plot_area_height;
/** Width of the plot area */
protected $plot_area_width;
/** Color (R,G,B,A) for plot area background */
protected $plot_bg_color;
/** Where to draw plot borders. Can be scalar or array of choices. */
protected $plot_border_type;
/** Max X of the plot area in world coordinates */
protected $plot_max_x;
/** Max Y of the plot area in world coordinates */
protected $plot_max_y;
/** Min X of the plot area in world coordinates */
protected $plot_min_x;
/** Min Y of the plot area in world coordinates */
protected $plot_min_y;
/** X device coordinate of the plot area origin */
protected $plot_origin_x;
/** Y device coordinate of the plot area origin */
protected $plot_origin_y;
/** Selected plot type */
protected $plot_type = 'linepoints';
/** Plot area background image filename */
protected $plotbgimg;
/** Plot area background image tiling mode */
protected $plotbgmode;
/** Array of plot type information, indexed by plot type */
static protected $plots = array(
'area' => array(
'draw_method' => 'DrawArea',
'abs_vals' => TRUE,
),
'bars' => array(
'draw_method' => 'DrawBars',
),
'boxes' => array(
'draw_method' => 'DrawBoxes',
'adjust_type' => 1, // See GetRangeEndAdjust()
),
'bubbles' => array(
'draw_method' => 'DrawBubbles',
'adjust_type' => 1, // See GetRangeEndAdjust()
),
'candlesticks' => array(
'draw_method' => 'DrawOHLC',
'draw_arg' => array(TRUE, FALSE), // Draw candlesticks, only fill if "closed down"
'adjust_type' => 2, // See GetRangeEndAdjust()
),
'candlesticks2' => array(
'draw_method' => 'DrawOHLC',
'draw_arg' => array(TRUE, TRUE), // Draw candlesticks, fill always
'adjust_type' => 2, // See GetRangeEndAdjust()
),
'linepoints' => array(
'draw_method' => 'DrawLinePoints',
'legend_alt_marker' => 'shape',
),
'lines' => array(
'draw_method' => 'DrawLines',
'legend_alt_marker' => 'line',
),
'ohlc' => array(
'draw_method' => 'DrawOHLC',
'draw_arg' => array(FALSE), // Don't draw candlesticks
'adjust_type' => 2, // See GetRangeEndAdjust()
),
'pie' => array(
'draw_method' => 'DrawPieChart',
'suppress_axes' => TRUE,
'abs_vals' => TRUE,
),
'points' => array(
'draw_method' => 'DrawDots',
'legend_alt_marker' => 'shape',
),
'squared' => array(
'draw_method' => 'DrawSquared',
'legend_alt_marker' => 'line',
),
'squaredarea' => array(
'draw_method' => 'DrawSquaredArea',
'abs_vals' => TRUE,
),
'stackedarea' => array(
'draw_method' => 'DrawArea',
'draw_arg' => array(TRUE), // Tells DrawArea to draw stacked area plot
'sum_vals' => TRUE,
'abs_vals' => TRUE,
),
'stackedbars' => array(
'draw_method' => 'DrawStackedBars',
'sum_vals' => TRUE,
),
'stackedsquaredarea' => array(
'draw_method' => 'DrawSquaredArea',
'draw_arg' => array(TRUE), // Tells DrawSquaredArea the data is cumulative
'sum_vals' => TRUE,
'abs_vals' => TRUE,
),
'thinbarline' => array(
'draw_method' => 'DrawThinBarLines',
),
);
/** Size of point_shapes and point_sizes arrays */
protected $point_counts;
/** Marker shapes for point plots */
protected $point_shapes = array(
'diamond', 'dot', 'delta', 'home', 'yield', 'box', 'circle', 'up', 'down', 'cross'
);
/** Marker sizes for point plots */
protected $point_sizes = array(6);
/** Flag: Automatic PrintImage after DrawGraph? */
protected $print_image = TRUE;
/** Tuning parameters for plot range calculation */
protected $rangectl = array( 'x' => array(
'adjust_mode' => 'T', // T=adjust to next tick
'adjust_amount' => NULL, // See GetRangeEndAdjust()
'zero_magnet' => 0.857142, // Value is 6/7
),
'y' => array(
'adjust_mode' => 'T', // T=adjust to next tick
'adjust_amount' => NULL, // See GetRangeEndAdjust()
'zero_magnet' => 0.857142, // Value is 6/7
));
/** Area for each bar in a bar chart */
protected $record_bar_width;
/** Maximum of num_recs[], max number of entries (including label and X if present) for all data rows */
protected $records_per_group;
/** Array mapping color names to array of R, G, B values */
protected $rgb_array;
/** Fixed extra margin used in multiple places */
public $safe_margin = 5;
/** Stores PHPlot version when object was serialized */
protected $saved_version;
/** Drop shadow size for pie and bar charts */
protected $shading = 5;
/** Skip bottom tick mark */
protected $skip_bottom_tick = FALSE;
/** Skip left tick mark */
protected $skip_left_tick = FALSE;
/** Skip right tick mark */
protected $skip_right_tick = FALSE;
/** Skip top tick mark */
protected $skip_top_tick = FALSE;
/** MIME boundary sequence used with streaming plots */
protected $stream_boundary;
/** Boundary and MIME header, output before each frame in a plot stream */
protected $stream_frame_header;
/** Name of the GD output function for this image type, used with streaming plots */
protected $stream_output_f;
/** Flag: Don't produce an error image on fatal error */
protected $suppress_error_image = FALSE;
/** Flag: Don't draw the X axis line */
protected $suppress_x_axis = FALSE;
/** Flag: Don't draw the Y axis line */
protected $suppress_y_axis = FALSE;
/** Color (R,G,B,A) for labels and legend text */
protected $text_color;
/** Character to use to group 1000s in formatted numbers */
protected $thousands_sep;
/** Color (R,G,B,A) for tick marks */
protected $tick_color;
/** Tuning parameters for tick increment calculation */
protected $tickctl = array( 'x' => array(
'tick_mode' => NULL,
'min_ticks' => 8,
'tick_inc_integer' => FALSE,
),
'y' => array(
'tick_mode' => NULL,
'min_ticks' => 8,
'tick_inc_integer' => FALSE,
));
/** Color (R,G,B,A) to use for tick labels */
protected $ticklabel_color;
/** Color (R,G,B,A) for main title (and default for X and Y titles) */
protected $title_color;
/** Y offset of main title position */
protected $title_offset;
/** Main title text */
protected $title_txt = '';
/** Total number of entries (rows times columns in each row) in the data array. */
protected $total_records;
/** Color (R,G,B,A) designated as transparent */
protected $transparent_color;
/** Flag: True if serialized object had a truecolor image */
protected $truecolor;
/** TrueType font directory */
protected $ttf_path = '.';
/** Default font type, True for TrueType, False for GD */
protected $use_ttf = FALSE;
/** Position of X axis (in world coordinates) */
protected $x_axis_position;
/** Device coordinate for the X axis */
protected $x_axis_y_pixels;
/** Effective X data label text angle */
protected $x_data_label_angle;
/** X data label text angle (see also x_data_label_angle) */
protected $x_data_label_angle_u = '';
/** Position of X data labels */
protected $x_data_label_pos;
/** X tick label text angle (and default for x_data_label_angle) */
protected $x_label_angle = 0;
/** Label offset relative to plot area */
protected $x_label_axis_offset;
/** Label offset relative to plot area */
protected $x_label_bot_offset;
/** Label offset relative to plot area */
protected $x_label_top_offset;
/** Calculated plot area margin - left side */
protected $x_left_margin;
/** Calculated plot area margin - right side */
protected $x_right_margin;
/** X tick anchor point */
protected $x_tick_anchor;
/** Length of X tick marks (inside plot area) */
protected $x_tick_cross = 3;
/** Effective step between X tick marks */
protected $x_tick_inc;
/** Step between X tick marks (see also x_tick_inc) */
protected $x_tick_inc_u = '';
/** Position of X tick labels */
protected $x_tick_label_pos;
/** Length of X tick marks (outside plot area) */
protected $x_tick_length = 5;
/** Position of X tick marks */
protected $x_tick_pos = 'plotdown';
/** Title offset relative to plot area */
protected $x_title_bot_offset;
/** Color (R,G,B,A) for X title */
protected $x_title_color;
/** X Axis title position */
protected $x_title_pos = 'none';
/** Title offset relative to plot area */
protected $x_title_top_offset;
/** X Axis title text */
protected $x_title_txt = '';
/** X scale factor for converting World to Device coordinates */
protected $xscale;
/** Linear or log scale on X */
protected $xscale_type = 'linear';
/** Position of Y axis (in world coordinates) */
protected $y_axis_position;
/** Device coordinate for the Y axis */
protected $y_axis_x_pixels;
/** Calculated plot area margin - bottom */
protected $y_bot_margin;
/** Y data label text angle */
protected $y_data_label_angle = 0;
/** Position of Y data labels */
protected $y_data_label_pos;
/** Y tick label text angle */
protected $y_label_angle = 0;
/** Label offset relative to plot area */
protected $y_label_axis_offset;
/** Label offset relative to plot area */
protected $y_label_left_offset;
/** Label offset relative to plot area */
protected $y_label_right_offset;
/** Y tick anchor point */
protected $y_tick_anchor;
/** Length of Y tick marks (inside plot area) */
protected $y_tick_cross = 3;
/** Effective step between Y tick marks */
protected $y_tick_inc;
/** Step between Y tick marks (see also y_tick_inc) */
protected $y_tick_inc_u = '';
/** Position of Y tick labels */
protected $y_tick_label_pos;
/** Length of Y tick marks (outside plot area) */
protected $y_tick_length = 5;
/** Position of Y tick marks */
protected $y_tick_pos = 'plotleft';
/** Color (R,G,B,A) for Y title */
protected $y_title_color;
/** Title offset relative to plot area */
protected $y_title_left_offset;
/** Y Axis title position */
protected $y_title_pos = 'none';
/** Title offset relative to plot area */
protected $y_title_right_offset;
/** Y Axis title text */
protected $y_title_txt = '';
/** Calculated plot area margin - top */
protected $y_top_margin;
/** Y scale factor for converting World to Device coordinates */
protected $yscale;
/** Linear or log scale on Y */
protected $yscale_type = 'linear';
/**
* Constructor: Sets up GD palette image resource, and initializes plot style controls
*
* @param int $width Image width in pixels
* @param int $height Image height in pixels
* @param string $output_file Path for output file. Omit, or NULL, or '' to mean no output file
* @param string $input_file Path to a file to be used as background. Omit, NULL, or '' for none
*/
function __construct($width=600, $height=400, $output_file=NULL, $input_file=NULL)
{
$this->initialize('imagecreate', $width, $height, $output_file, $input_file);
}
/**
* Initializes a PHPlot object (used by PHPlot and PHPlot_truecolor constructors)
*
* @param string $imagecreate_function GD function to use: imagecreate or imagecreatetruecolor
* @param int $width Image width in pixels
* @param int $height Image height in pixels
* @param string $output_file Path for output file. Omit, or NULL, or '' to mean no output file
* @param string $input_file Path to a file to be used as background. Omit, NULL, or '' for none
* @since 5.6.0
*/
protected function initialize($imagecreate_function, $width, $height, $output_file, $input_file)
{
$this->SetRGBArray('small');
if (isset($output_file) && $output_file !== '')
$this->SetOutputFile($output_file);
if (isset($input_file) && $input_file !== '') {
$this->SetInputFile($input_file);
} else {
$this->image_width = $width;
$this->image_height = $height;
$this->img = call_user_func($imagecreate_function, $width, $height);
if (!$this->img)
return $this->PrintError(get_class($this) . '(): Could not create image resource.');
}
$this->SetDefaultStyles();
$this->SetDefaultFonts();
}
/**
* Prepares object for serialization
*
* The image resource cannot be serialized. But rather than try to filter it out from the other
* properties, just let PHP serialize it (it will become an integer=0), and then fix it in __wakeup.
* This way the object is still usable after serialize().
* Note: This does not work if an input file was provided to the constructor.
*
* @return string[] Array of object property names, as required by PHP spec for __sleep()
* @since 5.8.0
*/
function __sleep()
{
$this->truecolor = imageistruecolor($this->img); // Remember image type
$this->saved_version = self::version; // Remember version of PHPlot, for checking on unserialize
return array_keys(get_object_vars($this));
}
/**
* Cleans up object after unserialization
*
* Recreates the image resource (which is not serializable), after validating the PHPlot version.
* @since 5.8.0
*/
function __wakeup()
{
if (strcmp($this->saved_version, self::version) != 0)
$this->PrintError(get_class($this) . '(): Unserialize version mismatch');
$imagecreate_function = $this->truecolor ? 'imagecreatetruecolor' : 'imagecreate';
$this->img = call_user_func($imagecreate_function, $this->image_width, $this->image_height);
if (!$this->img)
$this->PrintError(get_class($this) . '(): Could not create image resource.');
unset($this->truecolor, $this->saved_version);
}
/**
* Reads an image file (used by constructor via SetInput file, and by tile_img for backgrounds)
*
* @param string $image_filename Filename of the image file to read
* @param int $width Reference variable for width of the image in pixels
* @param int $height Reference variable for height of the image in pixels
* @return resource Image resource (False on error if an error handler returns True)
* @since 5.0.4
*/
protected function GetImage($image_filename, &$width, &$height)
{
$error = '';
$size = getimagesize($image_filename);
if (!$size) {
$error = "Unable to query image file $image_filename";
} else {
$image_type = $size[2];
switch ($image_type) {
case IMAGETYPE_GIF:
$img = @ ImageCreateFromGIF ($image_filename);
break;
case IMAGETYPE_PNG:
$img = @ ImageCreateFromPNG ($image_filename);
break;
case IMAGETYPE_JPEG:
$img = @ ImageCreateFromJPEG ($image_filename);
break;
default:
$error = "Unknown image type ($image_type) for image file $image_filename";
break;
}
}
if (empty($error) && !$img) {
// getimagesize is OK, but GD won't read it. Maybe unsupported format.
$error = "Failed to read image file $image_filename";
}
if (!empty($error)) {
return $this->PrintError("GetImage(): $error");
}
$width = $size[0];
$height = $size[1];
return $img;
}
/**
* Selects an input file to be used as background for the whole graph
*
* @param string $which_input_file Pathname to the image file to use as a background
* @deprecated Public use discouraged; intended for use by class constructor
* @return bool True (False on error if an error handler returns True)
*/
function SetInputFile($which_input_file)
{
$im = $this->GetImage($which_input_file, $this->image_width, $this->image_height);
if (!$im)
return FALSE; // GetImage already produced an error message.
// Deallocate any resources previously allocated
if (isset($this->img))
imagedestroy($this->img);
$this->img = $im;
// Do not overwrite the input file with the background color.
$this->done['background'] = TRUE;
return TRUE;
}
/////////////////////////////////////////////
////////////// COLORS
/////////////////////////////////////////////
/**
* Allocates a GD color index for a color specified as an array (R,G,B,A)
*
* At drawing time, this allocates a GD color index for the specified color, which
* is specified as a 4 component array. Earlier, when a color is specified,
* SetRGBColor() parsed and checked it and converted it to this component array form.
*
* @param int[] $color Color specification as (R, G, B, A), or unset variable
* @param int $default_color_index An already-allocated GD color index to use if $color is unset
* @return int A GD color index that can be used when drawing
* @since 5.2.0
*/
protected function GetColorIndex(&$color, $default_color_index = 0)
{
if (empty($color)) return $default_color_index;
list($r, $g, $b, $a) = $color;
return imagecolorresolvealpha($this->img, $r, $g, $b, $a);
}
/**
* Allocates an array of GD color indexes from an array of color specification arrays
*
* This is used for the data_colors array, for example.
* Note: $color_array must use 0-based sequential integer indexes.
*
* @param array $color_array Array of color specifications, each an array (R,G,B,A)
* @param int $max_colors Limit color allocation to no more than this number of colors
* @return int[] Array of GD color indexes that can be used when drawing
* @since 5.3.1
*/
protected function GetColorIndexArray($color_array, $max_colors)
{
$n = min(count($color_array), $max_colors);
$result = array();
for ($i = 0; $i < $n; $i++)
$result[] = $this->GetColorIndex($color_array[$i]);
return $result;
}
/**
* Allocates an array of GD color indexes for darker shades from an array of color specifications
*
* This is used for shadow colors such as those in bar charts with shading.
*
* @param array $color_array Array of color specifications, each an array (R,G,B,A)
* @param int $max_colors Limit color allocation to no more than this number of colors
* @return int[] Array of GD color indexes that can be used when drawing shadow colors
* @since 5.3.1
*/
protected function GetDarkColorIndexArray($color_array, $max_colors)
{
$n = min(count($color_array), $max_colors);
$result = array();
for ($i = 0; $i < $n; $i++)
$result[] = $this->GetDarkColorIndex($color_array[$i]);
return $result;
}
/**
* Allocates a GD color index for a darker shade of a color specified as an array (R,G,B,A)
*
* See notes on GetColorIndex() above.
*
* @param int[] $color Color specification as (R, G, B, A)
* @return int A GD color index that can be used when drawing a shadow color
* @since 5.2.0
*/
protected function GetDarkColorIndex($color)
{
list ($r, $g, $b, $a) = $color;
$r = max(0, $r - 0x30);
$g = max(0, $g - 0x30);
$b = max(0, $b - 0x30);
return imagecolorresolvealpha($this->img, $r, $g, $b, $a);
}
/**
* Sets or reverts all colors and styles to their defaults
*
* @return bool True always
*/
protected function SetDefaultStyles()
{
$this->SetDefaultDashedStyle($this->dashed_style);
$this->SetImageBorderColor(array(194, 194, 194));
$this->SetPlotBgColor('white');
$this->SetBackgroundColor('white');
$this->SetTextColor('black');
$this->SetGridColor('black');
$this->SetLightGridColor('gray');
$this->SetTickColor('black');
$this->SetTitleColor('black');
// These functions set up the default colors when called without parameters
$this->SetDataColors();
$this->SetErrorBarColors();
$this->SetDataBorderColors();
return TRUE;
}
/**
* Sets the overall image background color
*
* @param string|int[] $which_color Color name or spec (#rrggbb, (r,g,b) array, etc)
* @return bool True (False on error if an error handler returns True)
*/
function SetBackgroundColor($which_color)
{
return (bool)($this->bg_color = $this->SetRGBColor($which_color));
}
/**
* Sets the plot area background color, which is only drawn if SetDrawPlotAreaBackground is used.
*
* @param string|int[] $which_color Color name or spec (#rrggbb, (r,g,b) array, etc)
* @return bool True (False on error if an error handler returns True)
*/
function SetPlotBgColor($which_color)
{
return (bool)($this->plot_bg_color = $this->SetRGBColor($which_color));
}
/**
* Sets the color of the plot title, and the default color of the X and Y titles.
*
* @param string|int[] $which_color Color name or spec (#rrggbb, (r,g,b) array, etc)
* @return bool True (False on error if an error handler returns True)
*/
function SetTitleColor($which_color)
{
return (bool)($this->title_color = $this->SetRGBColor($which_color));
}
/**
* Sets the color of the X title, overriding the color set with SetTitleColor()
*
* @param string|int[] $which_color Color name or spec (#rrggbb, (r,g,b) array, etc)
* @return bool True (False on error if an error handler returns True)
* @since 5.2.0
*/
function SetXTitleColor($which_color)
{
return (bool)($this->x_title_color = $this->SetRGBColor($which_color));
}
/**
* Sets the color of the Y title, overriding the color set with SetTitleColor()
*
* @param string|int[] $which_color Color name or spec (#rrggbb, (r,g,b) array, etc)
* @return bool True (False on error if an error handler returns True)
* @since 5.2.0
*/
function SetYTitleColor($which_color)
{
return (bool)($this->y_title_color = $this->SetRGBColor($which_color));
}
/**
* Sets the color of the axis tick marks
*
* @param string|int[] $which_color Color name or spec (#rrggbb, (r,g,b) array, etc)
* @return bool True (False on error if an error handler returns True)
*/
function SetTickColor($which_color)
{
return (bool)($this->tick_color = $this->SetRGBColor($which_color));
}
/**
* @deprecated Use SetTitleColor() instead
*/
function SetLabelColor($which_color)
{
return $this->SetTitleColor($which_color);
}
/**
* Sets the general text color, which is the default color for legend text, tick and data labels
*
* @param string|int[] $which_color Color name or spec (#rrggbb, (r,g,b) array, etc)
* @return bool True (False on error if an error handler returns True)
*/
function SetTextColor($which_color)
{
return (bool)($this->text_color = $this->SetRGBColor($which_color));
}
/**
* Sets the color for data labels, overriding the default set with SetTextColor()
*
* @param string|int[] $which_color Color name or spec (#rrggbb, (r,g,b) array, etc)
* @return bool True (False on error if an error handler returns True)
* @since 5.7.0
*/
function SetDataLabelColor($which_color)
{
return (bool)($this->datalabel_color = $this->SetRGBColor($which_color));
}
/**
* Sets the color for data value labels, overriding SetTextColor() and SetDataLabelColor()
*
* Note: Data Value Labels are the labels within the plot area (not the axis labels).
*
* @param string|int[] $which_color Color name or spec (#rrggbb, (r,g,b) array, etc)
* @return bool True (False on error if an error handler returns True)
* @since 5.7.0
*/
function SetDataValueLabelColor($which_color)
{
return (bool)($this->dvlabel_color = $this->SetRGBColor($which_color));
}
/**
* Sets the color for pie chart data labels, overriding the default set with SetGridColor()
*
* @param string|int[] $which_color Color name or spec (#rrggbb, (r,g,b) array, etc)
* @return bool True (False on error if an error handler returns True)
* @since 5.7.0
*/
function SetPieLabelColor($which_color)
{
return (bool)($this->pielabel_color = $this->SetRGBColor($which_color));
}
/**
* Sets the color for pie chart segment borders
*
* @param string|int[] $which_color Color name or spec (#rrggbb, (r,g,b) array, etc)
* @return bool True (False on error if an error handler returns True)
* @since 6.0.0
*/
function SetPieBorderColor($which_color)
{
return (bool)($this->pieborder_color = $this->SetRGBColor($which_color));
}
/**
* Sets the color for tick labels, overriding the default set with SetTextColor()
*
* @param string|int[] $which_color Color name or spec (#rrggbb, (r,g,b) array, etc)
* @return bool True (False on error if an error handler returns True)
* @since 5.7.0
*/
function SetTickLabelColor($which_color)
{
return (bool)($this->ticklabel_color = $this->SetRGBColor($which_color));
}
/**
* Sets the X and Y grid colors, and the data label line color
*
* @param string|int[] $which_color Color name or spec (#rrggbb, (r,g,b) array, etc)
* @return bool True (False on error if an error handler returns True)
*/
function SetLightGridColor($which_color)
{
return (bool)($this->light_grid_color = $this->SetRGBColor($which_color));
}
/**
* Sets the color used for the X and Y axis lines, plot border, and legend border
*
* Also sets the default color for the pie chart data labels and pie chart segment borders.
* These can be overridden by SetPieLabelColor() and SetPieBorderColor() respectively.
* Note: This has nothing to do with the grid, and we don't know where this name came from.
*
* @param string|int[] $which_color Color name or spec (#rrggbb, (r,g,b) array, etc)
* @return bool True (False on error if an error handler returns True)
*/
function SetGridColor($which_color)
{
return (bool)($this->grid_color = $this->SetRGBColor($which_color));
}
/**
* Sets the color used for the image border, drawn if SetImageBorderType() enables it
*
* @param string|int[] $which_color Color name or spec (#rrggbb, (r,g,b) array, etc)
* @return bool True (False on error if an error handler returns True)
*/
function SetImageBorderColor($which_color)
{
return (bool)($this->i_border = $this->SetRGBColor($which_color));
}
/**
* Designates a color to be transparent, if transparency is supported by the image format
*
* @param string|int[]|null $which_color Color to make transparent; empty|omit|NULL to reset to none
* @return bool True (False on error if an error handler returns True)
*/
function SetTransparentColor($which_color = NULL)
{
$this->transparent_color = empty($which_color) ? NULL : $this->SetRGBColor($which_color);
return ($this->transparent_color !== FALSE); // True unless SetRGBColor() returned an error
}
/**
* Sets the color used for the legend background, which defaults to the image background color
*
* @param string|int[] $which_color Color name or spec (#rrggbb, (r,g,b) array, etc)
* @return bool True (False on error if an error handler returns True)
* @since 6.0.0
*/
function SetLegendBgColor($which_color)
{
return (bool)($this->legend_bg_color = $this->SetRGBColor($which_color));
}
/**
* Sets the color used for the legend text, which defaults to the general text color
*
* @param string|int[] $which_color Color name or spec (#rrggbb, (r,g,b) array, etc)
* @return bool True (False on error if an error handler returns True)
* @since 6.0.0
*/
function SetLegendTextColor($which_color)
{
return (bool)($this->legend_text_color = $this->SetRGBColor($which_color));
}
/**
* Sets the array of colors to be used (the color map)
*
* The color map maps color names into arrays of R, G, B and optionally A values.
* The selected color map can be user defined, a small predefined one,
* or a large one included from the file 'rgb.inc.php'.
*
* @param array|string $which_color_array Color map array (name=>(R,G,B[,A]), or keyword small | large
* @return bool True always
*/
function SetRGBArray($which_color_array)
{
if (is_array($which_color_array)) { // User defined array
$this->rgb_array = $which_color_array;
} elseif ($which_color_array == 'small') { // Small predefined color array
$this->rgb_array = array(
'white' => array(255, 255, 255),
'snow' => array(255, 250, 250),
'PeachPuff' => array(255, 218, 185),
'ivory' => array(255, 255, 240),
'lavender' => array(230, 230, 250),
'black' => array( 0, 0, 0),
'DimGrey' => array(105, 105, 105),
'gray' => array(190, 190, 190),
'grey' => array(190, 190, 190),
'navy' => array( 0, 0, 128),
'SlateBlue' => array(106, 90, 205),
'blue' => array( 0, 0, 255),
'SkyBlue' => array(135, 206, 235),
'cyan' => array( 0, 255, 255),
'DarkGreen' => array( 0, 100, 0),
'green' => array( 0, 255, 0),
'YellowGreen' => array(154, 205, 50),
'yellow' => array(255, 255, 0),
'orange' => array(255, 165, 0),
'gold' => array(255, 215, 0),
'peru' => array(205, 133, 63),
'beige' => array(245, 245, 220),
'wheat' => array(245, 222, 179),
'tan' => array(210, 180, 140),
'brown' => array(165, 42, 42),
'salmon' => array(250, 128, 114),
'red' => array(255, 0, 0),
'pink' => array(255, 192, 203),
'maroon' => array(176, 48, 96),
'magenta' => array(255, 0, 255),
'violet' => array(238, 130, 238),
'plum' => array(221, 160, 221),
'orchid' => array(218, 112, 214),
'purple' => array(160, 32, 240),
'azure1' => array(240, 255, 255),
'aquamarine1' => array(127, 255, 212)
);
} elseif ($which_color_array == 'large') { // Large color array
if (!@include('rgb.inc.php')) {
return $this->PrintError("SetRGBArray(): Large color map could not be loaded "
. "from 'rgb.inc.php'.");
}
$this->rgb_array = $ColorArray;
} else {
return $this->PrintError("SetRGBArray(): Invalid color map selection");
}
return TRUE;
}
/**
* Parses a color specification and returns the color component values
*
* Accepted color specification forms are (1) component array: array(R,G,B)
* or array(R,G,B,A); (2) component string hexadecimal: "#RRGGBB" or
* "#RRGGBBAA"; (3) A color name from the color map array with optional
* alpha value suffix as ":alpha". R, G, and B are integers 0-255, and
* Alpha is 0 (opaque) to 127 (transparent).
*
* @param string|int[] $color_asked Color spec to parse (color name, #rrggbb, (r,g,b) array, etc)
* @param int $alpha Optional default alpha value (0-127, default 0 for opaque)
* @return int[] Color component values as array (red, green, blue, alpha)
* @deprecated Public use discouraged; intended for class internal use
*/
function SetRGBColor($color_asked, $alpha = 0)
{
if (empty($color_asked)) {
$ret_val = array(0, 0, 0);
} elseif (is_array($color_asked) && (($n = count($color_asked)) == 3 || $n == 4) ) {
// Already an array of 3 or 4 elements:
$ret_val = $color_asked;
} elseif (preg_match('/^#([0-9a-f]{2})([0-9a-f]{2})([0-9a-f]{2})([0-9a-f]{2})?$/i',
$color_asked, $ss)) {
// #RRGGBB or #RRGGBBAA notation:
$ret_val = array(hexdec($ss[1]), hexdec($ss[2]), hexdec($ss[3]));
if (isset($ss[4])) $ret_val[] = hexdec($ss[4]);
} elseif (isset($this->rgb_array[$color_asked])) {
// Color by name:
$ret_val = $this->rgb_array[$color_asked];
} elseif (preg_match('/(.+):([\d]+)$/', $color_asked, $ss)
&& isset($this->rgb_array[$ss[1]])) {
// Color by name with ":alpha" suffix, alpha is a decimal number:
$ret_val = $this->rgb_array[$ss[1]];
$ret_val[3] = (int)$ss[2];
} else {
return $this->PrintError("SetRGBColor(): Color '$color_asked' is not valid.");
}
// Append alpha if not already provided for:
if (count($ret_val) == 3)
$ret_val[] = $alpha;
return $ret_val;
}
/**
* Sets the colors used for plotting data sets, with optional default alpha value
*
* If passed an array, use the values as colors for sequential data sets.
* If passed a single color specification, plot all data sets using that
* single color.
* Special use cases for the $which_data argument: Missing or NULL loads
* the default data color map if no map is already set; an empty string or
* False loads the default color map even if a color map is already set.
* Note: The default value for $alpha here is NULL, not 0, so we can tell
* if it was defaulted. But the effective default value is 0 (opaque).
*
* @param array|string $which_data Array of color specifications, or one color, or empty
* @param array|string $which_border Data border colors, deprecated - use SetDataBorderColors() instead
* @param int $alpha Default alpha to apply to all data colors that do not have an alpha value
* @return bool True (False on error if an error handler returns True)
*/
function SetDataColors($which_data = NULL, $which_border = NULL, $alpha = NULL)
{
if (is_array($which_data)) {
$colors = $which_data; // Use supplied array
} elseif (!empty($which_data)) {
$colors = array($which_data); // Use supplied single color
} elseif (empty($this->data_colors) || !is_null($which_data)) {
$colors = $this->default_colors; // Use default color array
} else {
// which_data is NULL or missing and a color array is already set.
// The existing color array is left alone, except that if $alpha is
// given this will replace the alpha value of each existing color.
// This makes SetDataColors(NULL, NULL, $alpha) work.
if (isset($alpha)) {
$n_colors = count($this->data_colors);
for ($i = 0; $i < $n_colors; $i++) {
$this->data_colors[$i][3] = $alpha; // Component 3 = alpha value
}
}
// No need to reparse the colors or anything else.
return TRUE;
}
if (!isset($alpha))
$alpha = 0; // Actual default is opaque colors.
// Check each color and convert to array (r,g,b,a) form.
// Use the $alpha argument as a default for the alpha value of each color.
$this->data_colors = array();
foreach ($colors as $color) {
$color_array = $this->SetRGBColor($color, $alpha);
if (!$color_array) return FALSE; // SetRGBColor already did an error message.
$this->data_colors[] = $color_array;
}
// For past compatibility:
return $this->SetDataBorderColors($which_border);
}
/**
* Sets the colors used for data borders in some plot types
*
* For plot types which support data borders, such as 'bars', this sets
* the colors used for those borders. See also SetDrawDataBorders().
* Special cases: If $which_br is missing or NULL, use the default of all
* black if colors were not already set; if an empty string or False then
* set the default of all black regardless.
*
* @param array|string $which_br Array of color specifications, or one color, or empty
* @return bool True (False on error if an error handler returns True)
*/
function SetDataBorderColors($which_br = NULL)
{
if (is_array($which_br)) {
$colors = $which_br; // Use supplied array
} elseif (!empty($which_br)) {
$colors = array($which_br); // Use supplied single color
} elseif (empty($this->data_border_colors) || !is_null($which_br)) {
$colors = array('black'); // Use default
} else {
return TRUE; // Do nothing: which_br is NULL or missing and a color array is already set.
}
// Check each color and convert to array (r,g,b,a) form.
$this->data_border_colors = array();
foreach ($colors as $color) {
$color_array = $this->SetRGBColor($color);
if (!$color_array) return FALSE; // SetRGBColor already did an error message.
$this->data_border_colors[] = $color_array;
}
return TRUE;
}
/**
* Sets the colors used for data error bars
*
* Special cases for $which_err: Missing or NULL loads the default colors
* (same as default data colors) if no colors are aleady set; an empty
* string or False loads the default colors even if colors were already set.
*
* @param array|string $which_err Array of color specifications, or one color, or empty
* @return bool True (False on error if an error handler returns True)
*/
function SetErrorBarColors($which_err = NULL)
{
if (is_array($which_err)) {
$colors = $which_err; // Use supplied array
} elseif (!empty($which_err)) {
$colors = array($which_err); // Use supplied single color
} elseif (empty($this->error_bar_colors) || !is_null($which_err)) {
$colors = $this->default_colors; // Use default color array
} else {
return TRUE; // Do nothing: which_err is NULL or missing and a color array is already set.
}
// Check each color and convert to array (r,g,b,a) form.
$this->error_bar_colors = array();
foreach ($colors as $color) {
$color_array = $this->SetRGBColor($color);
if (!$color_array) return FALSE; // SetRGBColor already did an error message.
$this->error_bar_colors[] = $color_array;
}
return TRUE;
}
/**
* Sets the default dashed line style (on/off pattern for dashed lines)
*
* For example: SetDashedStyle('2-3-1-2') means 2 dots of color, 3
* transparent, 1 color, then 2 transparent.
* This builds a template string $this->default_dashed_style which contains
* a space-separated series of marker (#) for pixels on, and the value of
* IMG_COLOR_TRANSPARENT for each pixel which is off.
* See SetDashedStyle() for how it is used.
*
* @param string $which_style Dashed line specification, in the form Read Input Registers
";
echo "\n";
$air = array('Standby','PV and Grid Combined Discharge','Discharge','Fault','Flash','PV charge','AC charge','Combine charge','Combine charge and Bypass','PV charge and Bypass','AC charge and Bypass','Bypass','PV charge and Discharge');
//for($i=0; $i < 13; $i++) {  echo "$i $air[$i]\n"; };
for($i=0; $i < 32; $i+=2) {
    $j = $i+1;
    $register = str_pad($i,3," ", STR_PAD_LEFT);
    $register = $register/2;
    $hex = $result[$i].$result[$j];
    $dec = hexdec($hex);
    echo $register," ", 'hex Word ', $hex," decimal ", hexdec($hex);
    if ($register==0) echo "\tSystem Status = $hex $air[$dec]";
    if ($register==10) echo "\tOutput power = ", (hexdec($hex)*0.1)," watts";
    if ($register==12) echo "\tOutput power = ", (hexdec($hex)*0.1)," va";
    if ($register==14) echo "\tAC charge power = ", (hexdec($hex)*0.1)," watts";
    if ($register==16) echo "\tAC charge power = ", (hexdec($hex)*0.1)," va";
    echo chr(10);
    $regnos[] = $result[$i] . $result[$j];
}
echo "
\n";
$modbus->deviceClose();
?>
SetRGBArray('large')
* For more information on PHPlot see http://sourceforge.net/projects/phplot/
*
* rgb.inc.php comes with PHPlot but is derived from the X11 rgb.txt color
* database file, which contains no specific copyright notice. It may be
* covered by X.Org, XFree86, or MIT/X11 copyright and license, all of which
* allow redistribution on terms which are less strict than the LGPL which
* covers PHPlot.
*/
$ColorArray = array(
"snow" => array(255, 250, 250),
"ghost white" => array(248, 248, 255),
"GhostWhite" => array(248, 248, 255),
"white smoke" => array(245, 245, 245),
"WhiteSmoke" => array(245, 245, 245),
"gainsboro" => array(220, 220, 220),
"floral white" => array(255, 250, 240),
"FloralWhite" => array(255, 250, 240),
"old lace" => array(253, 245, 230),
"OldLace" => array(253, 245, 230),
"linen" => array(250, 240, 230),
"antique white" => array(250, 235, 215),
"AntiqueWhite" => array(250, 235, 215),
"papaya whip" => array(255, 239, 213),
"PapayaWhip" => array(255, 239, 213),
"blanched almond" => array(255, 235, 205),
"BlanchedAlmond" => array(255, 235, 205),
"bisque" => array(255, 228, 196),
"peach puff" => array(255, 218, 185),
"PeachPuff" => array(255, 218, 185),
"navajo white" => array(255, 222, 173),
"NavajoWhite" => array(255, 222, 173),
"moccasin" => array(255, 228, 181),
"cornsilk" => array(255, 248, 220),
"ivory" => array(255, 255, 240),
"lemon chiffon" => array(255, 250, 205),
"LemonChiffon" => array(255, 250, 205),
"seashell" => array(255, 245, 238),
"honeydew" => array(240, 255, 240),
"mint cream" => array(245, 255, 250),
"MintCream" => array(245, 255, 250),
"azure" => array(240, 255, 255),
"alice blue" => array(240, 248, 255),
"AliceBlue" => array(240, 248, 255),
"lavender" => array(230, 230, 250),
"lavender blush" => array(255, 240, 245),
"LavenderBlush" => array(255, 240, 245),
"misty rose" => array(255, 228, 225),
"MistyRose" => array(255, 228, 225),
"white" => array(255, 255, 255),
"black" => array( 0, 0, 0),
"dark slate gray" => array( 47, 79, 79),
"DarkSlateGray" => array( 47, 79, 79),
"dark slate grey" => array( 47, 79, 79),
"DarkSlateGrey" => array( 47, 79, 79),
"dim gray" => array(105, 105, 105),
"DimGray" => array(105, 105, 105),
"dim grey" => array(105, 105, 105),
"DimGrey" => array(105, 105, 105),
"slate gray" => array(112, 128, 144),
"SlateGray" => array(112, 128, 144),
"slate grey" => array(112, 128, 144),
"SlateGrey" => array(112, 128, 144),
"light slate gray" => array(119, 136, 153),
"LightSlateGray" => array(119, 136, 153),
"light slate grey" => array(119, 136, 153),
"LightSlateGrey" => array(119, 136, 153),
"gray" => array(190, 190, 190),
"grey" => array(190, 190, 190),
"light grey" => array(211, 211, 211),
"LightGrey" => array(211, 211, 211),
"light gray" => array(211, 211, 211),
"LightGray" => array(211, 211, 211),
"midnight blue" => array( 25, 25, 112),
"MidnightBlue" => array( 25, 25, 112),
"navy" => array( 0, 0, 128),
"navy blue" => array( 0, 0, 128),
"NavyBlue" => array( 0, 0, 128),
"cornflower blue" => array(100, 149, 237),
"CornflowerBlue" => array(100, 149, 237),
"dark slate blue" => array( 72, 61, 139),
"DarkSlateBlue" => array( 72, 61, 139),
"slate blue" => array(106, 90, 205),
"SlateBlue" => array(106, 90, 205),
"medium slate blue" => array(123, 104, 238),
"MediumSlateBlue" => array(123, 104, 238),
"light slate blue" => array(132, 112, 255),
"LightSlateBlue" => array(132, 112, 255),
"medium blue" => array( 0, 0, 205),
"MediumBlue" => array( 0, 0, 205),
"royal blue" => array( 65, 105, 225),
"RoyalBlue" => array( 65, 105, 225),
"blue" => array( 0, 0, 255),
"dodger blue" => array( 30, 144, 255),
"DodgerBlue" => array( 30, 144, 255),
"deep sky blue" => array( 0, 191, 255),
"DeepSkyBlue" => array( 0, 191, 255),
"sky blue" => array(135, 206, 235),
"SkyBlue" => array(135, 206, 235),
"light sky blue" => array(135, 206, 250),
"LightSkyBlue" => array(135, 206, 250),
"steel blue" => array( 70, 130, 180),
"SteelBlue" => array( 70, 130, 180),
"light steel blue" => array(176, 196, 222),
"LightSteelBlue" => array(176, 196, 222),
"light blue" => array(173, 216, 230),
"LightBlue" => array(173, 216, 230),
"powder blue" => array(176, 224, 230),
"PowderBlue" => array(176, 224, 230),
"pale turquoise" => array(175, 238, 238),
"PaleTurquoise" => array(175, 238, 238),
"dark turquoise" => array( 0, 206, 209),
"DarkTurquoise" => array( 0, 206, 209),
"medium turquoise" => array( 72, 209, 204),
"MediumTurquoise" => array( 72, 209, 204),
"turquoise" => array( 64, 224, 208),
"cyan" => array( 0, 255, 255),
"light cyan" => array(224, 255, 255),
"LightCyan" => array(224, 255, 255),
"cadet blue" => array( 95, 158, 160),
"CadetBlue" => array( 95, 158, 160),
"medium aquamarine" => array(102, 205, 170),
"MediumAquamarine" => array(102, 205, 170),
"aquamarine" => array(127, 255, 212),
"dark green" => array( 0, 100, 0),
"DarkGreen" => array( 0, 100, 0),
"dark olive green" => array( 85, 107, 47),
"DarkOliveGreen" => array( 85, 107, 47),
"dark sea green" => array(143, 188, 143),
"DarkSeaGreen" => array(143, 188, 143),
"sea green" => array( 46, 139, 87),
"SeaGreen" => array( 46, 139, 87),
"medium sea green" => array( 60, 179, 113),
"MediumSeaGreen" => array( 60, 179, 113),
"light sea green" => array( 32, 178, 170),
"LightSeaGreen" => array( 32, 178, 170),
"pale green" => array(152, 251, 152),
"PaleGreen" => array(152, 251, 152),
"spring green" => array( 0, 255, 127),
"SpringGreen" => array( 0, 255, 127),
"lawn green" => array(124, 252, 0),
"LawnGreen" => array(124, 252, 0),
"green" => array( 0, 255, 0),
"chartreuse" => array(127, 255, 0),
"medium spring green" => array( 0, 250, 154),
"MediumSpringGreen" => array( 0, 250, 154),
"green yellow" => array(173, 255, 47),
"GreenYellow" => array(173, 255, 47),
"lime green" => array( 50, 205, 50),
"LimeGreen" => array( 50, 205, 50),
"yellow green" => array(154, 205, 50),
"YellowGreen" => array(154, 205, 50),
"forest green" => array( 34, 139, 34),
"ForestGreen" => array( 34, 139, 34),
"olive drab" => array(107, 142, 35),
"OliveDrab" => array(107, 142, 35),
"dark khaki" => array(189, 183, 107),
"DarkKhaki" => array(189, 183, 107),
"khaki" => array(240, 230, 140),
"pale goldenrod" => array(238, 232, 170),
"PaleGoldenrod" => array(238, 232, 170),
"light goldenrod yellow" => array(250, 250, 210),
"LightGoldenrodYellow" => array(250, 250, 210),
"light yellow" => array(255, 255, 224),
"LightYellow" => array(255, 255, 224),
"yellow" => array(255, 255, 0),
"gold" => array(255, 215, 0),
"light goldenrod" => array(238, 221, 130),
"LightGoldenrod" => array(238, 221, 130),
"goldenrod" => array(218, 165, 32),
"dark goldenrod" => array(184, 134, 11),
"DarkGoldenrod" => array(184, 134, 11),
"rosy brown" => array(188, 143, 143),
"RosyBrown" => array(188, 143, 143),
"indian red" => array(205, 92, 92),
"IndianRed" => array(205, 92, 92),
"saddle brown" => array(139, 69, 19),
"SaddleBrown" => array(139, 69, 19),
"sienna" => array(160, 82, 45),
"peru" => array(205, 133, 63),
"burlywood" => array(222, 184, 135),
"beige" => array(245, 245, 220),
"wheat" => array(245, 222, 179),
"sandy brown" => array(244, 164, 96),
"SandyBrown" => array(244, 164, 96),
"tan" => array(210, 180, 140),
"chocolate" => array(210, 105, 30),
"firebrick" => array(178, 34, 34),
"brown" => array(165, 42, 42),
"dark salmon" => array(233, 150, 122),
"DarkSalmon" => array(233, 150, 122),
"salmon" => array(250, 128, 114),
"light salmon" => array(255, 160, 122),
"LightSalmon" => array(255, 160, 122),
"orange" => array(255, 165, 0),
"dark orange" => array(255, 140, 0),
"DarkOrange" => array(255, 140, 0),
"coral" => array(255, 127, 80),
"light coral" => array(240, 128, 128),
"LightCoral" => array(240, 128, 128),
"tomato" => array(255, 99, 71),
"orange red" => array(255, 69, 0),
"OrangeRed" => array(255, 69, 0),
"red" => array(255, 0, 0),
"hot pink" => array(255, 105, 180),
"HotPink" => array(255, 105, 180),
"deep pink" => array(255, 20, 147),
"DeepPink" => array(255, 20, 147),
"pink" => array(255, 192, 203),
"light pink" => array(255, 182, 193),
"LightPink" => array(255, 182, 193),
"pale violet red" => array(219, 112, 147),
"PaleVioletRed" => array(219, 112, 147),
"maroon" => array(176, 48, 96),
"medium violet red" => array(199, 21, 133),
"MediumVioletRed" => array(199, 21, 133),
"violet red" => array(208, 32, 144),
"VioletRed" => array(208, 32, 144),
"magenta" => array(255, 0, 255),
"violet" => array(238, 130, 238),
"plum" => array(221, 160, 221),
"orchid" => array(218, 112, 214),
"medium orchid" => array(186, 85, 211),
"MediumOrchid" => array(186, 85, 211),
"dark orchid" => array(153, 50, 204),
"DarkOrchid" => array(153, 50, 204),
"dark violet" => array(148, 0, 211),
"DarkViolet" => array(148, 0, 211),
"blue violet" => array(138, 43, 226),
"BlueViolet" => array(138, 43, 226),
"purple" => array(160, 32, 240),
"medium purple" => array(147, 112, 219),
"MediumPurple" => array(147, 112, 219),
"thistle" => array(216, 191, 216),
"snow1" => array(255, 250, 250),
"snow2" => array(238, 233, 233),
"snow3" => array(205, 201, 201),
"snow4" => array(139, 137, 137),
"seashell1" => array(255, 245, 238),
"seashell2" => array(238, 229, 222),
"seashell3" => array(205, 197, 191),
"seashell4" => array(139, 134, 130),
"AntiqueWhite1" => array(255, 239, 219),
"AntiqueWhite2" => array(238, 223, 204),
"AntiqueWhite3" => array(205, 192, 176),
"AntiqueWhite4" => array(139, 131, 120),
"bisque1" => array(255, 228, 196),
"bisque2" => array(238, 213, 183),
"bisque3" => array(205, 183, 158),
"bisque4" => array(139, 125, 107),
"PeachPuff1" => array(255, 218, 185),
"PeachPuff2" => array(238, 203, 173),
"PeachPuff3" => array(205, 175, 149),
"PeachPuff4" => array(139, 119, 101),
"NavajoWhite1" => array(255, 222, 173),
"NavajoWhite2" => array(238, 207, 161),
"NavajoWhite3" => array(205, 179, 139),
"NavajoWhite4" => array(139, 121, 94),
"LemonChiffon1" => array(255, 250, 205),
"LemonChiffon2" => array(238, 233, 191),
"LemonChiffon3" => array(205, 201, 165),
"LemonChiffon4" => array(139, 137, 112),
"cornsilk1" => array(255, 248, 220),
"cornsilk2" => array(238, 232, 205),
"cornsilk3" => array(205, 200, 177),
"cornsilk4" => array(139, 136, 120),
"ivory1" => array(255, 255, 240),
"ivory2" => array(238, 238, 224),
"ivory3" => array(205, 205, 193),
"ivory4" => array(139, 139, 131),
"honeydew1" => array(240, 255, 240),
"honeydew2" => array(224, 238, 224),
"honeydew3" => array(193, 205, 193),
"honeydew4" => array(131, 139, 131),
"LavenderBlush1" => array(255, 240, 245),
"LavenderBlush2" => array(238, 224, 229),
"LavenderBlush3" => array(205, 193, 197),
"LavenderBlush4" => array(139, 131, 134),
"MistyRose1" => array(255, 228, 225),
"MistyRose2" => array(238, 213, 210),
"MistyRose3" => array(205, 183, 181),
"MistyRose4" => array(139, 125, 123),
"azure1" => array(240, 255, 255),
"azure2" => array(224, 238, 238),
"azure3" => array(193, 205, 205),
"azure4" => array(131, 139, 139),
"SlateBlue1" => array(131, 111, 255),
"SlateBlue2" => array(122, 103, 238),
"SlateBlue3" => array(105, 89, 205),
"SlateBlue4" => array( 71, 60, 139),
"RoyalBlue1" => array( 72, 118, 255),
"RoyalBlue2" => array( 67, 110, 238),
"RoyalBlue3" => array( 58, 95, 205),
"RoyalBlue4" => array( 39, 64, 139),
"blue1" => array( 0, 0, 255),
"blue2" => array( 0, 0, 238),
"blue3" => array( 0, 0, 205),
"blue4" => array( 0, 0, 139),
"DodgerBlue1" => array( 30, 144, 255),
"DodgerBlue2" => array( 28, 134, 238),
"DodgerBlue3" => array( 24, 116, 205),
"DodgerBlue4" => array( 16, 78, 139),
"SteelBlue1" => array( 99, 184, 255),
"SteelBlue2" => array( 92, 172, 238),
"SteelBlue3" => array( 79, 148, 205),
"SteelBlue4" => array( 54, 100, 139),
"DeepSkyBlue1" => array( 0, 191, 255),
"DeepSkyBlue2" => array( 0, 178, 238),
"DeepSkyBlue3" => array( 0, 154, 205),
"DeepSkyBlue4" => array( 0, 104, 139),
"SkyBlue1" => array(135, 206, 255),
"SkyBlue2" => array(126, 192, 238),
"SkyBlue3" => array(108, 166, 205),
"SkyBlue4" => array( 74, 112, 139),
"LightSkyBlue1" => array(176, 226, 255),
"LightSkyBlue2" => array(164, 211, 238),
"LightSkyBlue3" => array(141, 182, 205),
"LightSkyBlue4" => array( 96, 123, 139),
"SlateGray1" => array(198, 226, 255),
"SlateGray2" => array(185, 211, 238),
"SlateGray3" => array(159, 182, 205),
"SlateGray4" => array(108, 123, 139),
"LightSteelBlue1" => array(202, 225, 255),
"LightSteelBlue2" => array(188, 210, 238),
"LightSteelBlue3" => array(162, 181, 205),
"LightSteelBlue4" => array(110, 123, 139),
"LightBlue1" => array(191, 239, 255),
"LightBlue2" => array(178, 223, 238),
"LightBlue3" => array(154, 192, 205),
"LightBlue4" => array(104, 131, 139),
"LightCyan1" => array(224, 255, 255),
"LightCyan2" => array(209, 238, 238),
"LightCyan3" => array(180, 205, 205),
"LightCyan4" => array(122, 139, 139),
"PaleTurquoise1" => array(187, 255, 255),
"PaleTurquoise2" => array(174, 238, 238),
"PaleTurquoise3" => array(150, 205, 205),
"PaleTurquoise4" => array(102, 139, 139),
"CadetBlue1" => array(152, 245, 255),
"CadetBlue2" => array(142, 229, 238),
"CadetBlue3" => array(122, 197, 205),
"CadetBlue4" => array( 83, 134, 139),
"turquoise1" => array( 0, 245, 255),
"turquoise2" => array( 0, 229, 238),
"turquoise3" => array( 0, 197, 205),
"turquoise4" => array( 0, 134, 139),
"cyan1" => array( 0, 255, 255),
"cyan2" => array( 0, 238, 238),
"cyan3" => array( 0, 205, 205),
"cyan4" => array( 0, 139, 139),
"DarkSlateGray1" => array(151, 255, 255),
"DarkSlateGray2" => array(141, 238, 238),
"DarkSlateGray3" => array(121, 205, 205),
"DarkSlateGray4" => array( 82, 139, 139),
"aquamarine1" => array(127, 255, 212),
"aquamarine2" => array(118, 238, 198),
"aquamarine3" => array(102, 205, 170),
"aquamarine4" => array( 69, 139, 116),
"DarkSeaGreen1" => array(193, 255, 193),
"DarkSeaGreen2" => array(180, 238, 180),
"DarkSeaGreen3" => array(155, 205, 155),
"DarkSeaGreen4" => array(105, 139, 105),
"SeaGreen1" => array( 84, 255, 159),
"SeaGreen2" => array( 78, 238, 148),
"SeaGreen3" => array( 67, 205, 128),
"SeaGreen4" => array( 46, 139, 87),
"PaleGreen1" => array(154, 255, 154),
"PaleGreen2" => array(144, 238, 144),
"PaleGreen3" => array(124, 205, 124),
"PaleGreen4" => array( 84, 139, 84),
"SpringGreen1" => array( 0, 255, 127),
"SpringGreen2" => array( 0, 238, 118),
"SpringGreen3" => array( 0, 205, 102),
"SpringGreen4" => array( 0, 139, 69),
"green1" => array( 0, 255, 0),
"green2" => array( 0, 238, 0),
"green3" => array( 0, 205, 0),
"green4" => array( 0, 139, 0),
"chartreuse1" => array(127, 255, 0),
"chartreuse2" => array(118, 238, 0),
"chartreuse3" => array(102, 205, 0),
"chartreuse4" => array( 69, 139, 0),
"OliveDrab1" => array(192, 255, 62),
"OliveDrab2" => array(179, 238, 58),
"OliveDrab3" => array(154, 205, 50),
"OliveDrab4" => array(105, 139, 34),
"DarkOliveGreen1" => array(202, 255, 112),
"DarkOliveGreen2" => array(188, 238, 104),
"DarkOliveGreen3" => array(162, 205, 90),
"DarkOliveGreen4" => array(110, 139, 61),
"khaki1" => array(255, 246, 143),
"khaki2" => array(238, 230, 133),
"khaki3" => array(205, 198, 115),
"khaki4" => array(139, 134, 78),
"LightGoldenrod1" => array(255, 236, 139),
"LightGoldenrod2" => array(238, 220, 130),
"LightGoldenrod3" => array(205, 190, 112),
"LightGoldenrod4" => array(139, 129, 76),
"LightYellow1" => array(255, 255, 224),
"LightYellow2" => array(238, 238, 209),
"LightYellow3" => array(205, 205, 180),
"LightYellow4" => array(139, 139, 122),
"yellow1" => array(255, 255, 0),
"yellow2" => array(238, 238, 0),
"yellow3" => array(205, 205, 0),
"yellow4" => array(139, 139, 0),
"gold1" => array(255, 215, 0),
"gold2" => array(238, 201, 0),
"gold3" => array(205, 173, 0),
"gold4" => array(139, 117, 0),
"goldenrod1" => array(255, 193, 37),
"goldenrod2" => array(238, 180, 34),
"goldenrod3" => array(205, 155, 29),
"goldenrod4" => array(139, 105, 20),
"DarkGoldenrod1" => array(255, 185, 15),
"DarkGoldenrod2" => array(238, 173, 14),
"DarkGoldenrod3" => array(205, 149, 12),
"DarkGoldenrod4" => array(139, 101, 8),
"RosyBrown1" => array(255, 193, 193),
"RosyBrown2" => array(238, 180, 180),
"RosyBrown3" => array(205, 155, 155),
"RosyBrown4" => array(139, 105, 105),
"IndianRed1" => array(255, 106, 106),
"IndianRed2" => array(238, 99, 99),
"IndianRed3" => array(205, 85, 85),
"IndianRed4" => array(139, 58, 58),
"sienna1" => array(255, 130, 71),
"sienna2" => array(238, 121, 66),
"sienna3" => array(205, 104, 57),
"sienna4" => array(139, 71, 38),
"burlywood1" => array(255, 211, 155),
"burlywood2" => array(238, 197, 145),
"burlywood3" => array(205, 170, 125),
"burlywood4" => array(139, 115, 85),
"wheat1" => array(255, 231, 186),
"wheat2" => array(238, 216, 174),
"wheat3" => array(205, 186, 150),
"wheat4" => array(139, 126, 102),
"tan1" => array(255, 165, 79),
"tan2" => array(238, 154, 73),
"tan3" => array(205, 133, 63),
"tan4" => array(139, 90, 43),
"chocolate1" => array(255, 127, 36),
"chocolate2" => array(238, 118, 33),
"chocolate3" => array(205, 102, 29),
"chocolate4" => array(139, 69, 19),
"firebrick1" => array(255, 48, 48),
"firebrick2" => array(238, 44, 44),
"firebrick3" => array(205, 38, 38),
"firebrick4" => array(139, 26, 26),
"brown1" => array(255, 64, 64),
"brown2" => array(238, 59, 59),
"brown3" => array(205, 51, 51),
"brown4" => array(139, 35, 35),
"salmon1" => array(255, 140, 105),
"salmon2" => array(238, 130, 98),
"salmon3" => array(205, 112, 84),
"salmon4" => array(139, 76, 57),
"LightSalmon1" => array(255, 160, 122),
"LightSalmon2" => array(238, 149, 114),
"LightSalmon3" => array(205, 129, 98),
"LightSalmon4" => array(139, 87, 66),
"orange1" => array(255, 165, 0),
"orange2" => array(238, 154, 0),
"orange3" => array(205, 133, 0),
"orange4" => array(139, 90, 0),
"DarkOrange1" => array(255, 127, 0),
"DarkOrange2" => array(238, 118, 0),
"DarkOrange3" => array(205, 102, 0),
"DarkOrange4" => array(139, 69, 0),
"coral1" => array(255, 114, 86),
"coral2" => array(238, 106, 80),
"coral3" => array(205, 91, 69),
"coral4" => array(139, 62, 47),
"tomato1" => array(255, 99, 71),
"tomato2" => array(238, 92, 66),
"tomato3" => array(205, 79, 57),
"tomato4" => array(139, 54, 38),
"OrangeRed1" => array(255, 69, 0),
"OrangeRed2" => array(238, 64, 0),
"OrangeRed3" => array(205, 55, 0),
"OrangeRed4" => array(139, 37, 0),
"red1" => array(255, 0, 0),
"red2" => array(238, 0, 0),
"red3" => array(205, 0, 0),
"red4" => array(139, 0, 0),
"DeepPink1" => array(255, 20, 147),
"DeepPink2" => array(238, 18, 137),
"DeepPink3" => array(205, 16, 118),
"DeepPink4" => array(139, 10, 80),
"HotPink1" => array(255, 110, 180),
"HotPink2" => array(238, 106, 167),
"HotPink3" => array(205, 96, 144),
"HotPink4" => array(139, 58, 98),
"pink1" => array(255, 181, 197),
"pink2" => array(238, 169, 184),
"pink3" => array(205, 145, 158),
"pink4" => array(139, 99, 108),
"LightPink1" => array(255, 174, 185),
"LightPink2" => array(238, 162, 173),
"LightPink3" => array(205, 140, 149),
"LightPink4" => array(139, 95, 101),
"PaleVioletRed1" => array(255, 130, 171),
"PaleVioletRed2" => array(238, 121, 159),
"PaleVioletRed3" => array(205, 104, 137),
"PaleVioletRed4" => array(139, 71, 93),
"maroon1" => array(255, 52, 179),
"maroon2" => array(238, 48, 167),
"maroon3" => array(205, 41, 144),
"maroon4" => array(139, 28, 98),
"VioletRed1" => array(255, 62, 150),
"VioletRed2" => array(238, 58, 140),
"VioletRed3" => array(205, 50, 120),
"VioletRed4" => array(139, 34, 82),
"magenta1" => array(255, 0, 255),
"magenta2" => array(238, 0, 238),
"magenta3" => array(205, 0, 205),
"magenta4" => array(139, 0, 139),
"orchid1" => array(255, 131, 250),
"orchid2" => array(238, 122, 233),
"orchid3" => array(205, 105, 201),
"orchid4" => array(139, 71, 137),
"plum1" => array(255, 187, 255),
"plum2" => array(238, 174, 238),
"plum3" => array(205, 150, 205),
"plum4" => array(139, 102, 139),
"MediumOrchid1" => array(224, 102, 255),
"MediumOrchid2" => array(209, 95, 238),
"MediumOrchid3" => array(180, 82, 205),
"MediumOrchid4" => array(122, 55, 139),
"DarkOrchid1" => array(191, 62, 255),
"DarkOrchid2" => array(178, 58, 238),
"DarkOrchid3" => array(154, 50, 205),
"DarkOrchid4" => array(104, 34, 139),
"purple1" => array(155, 48, 255),
"purple2" => array(145, 44, 238),
"purple3" => array(125, 38, 205),
"purple4" => array( 85, 26, 139),
"MediumPurple1" => array(171, 130, 255),
"MediumPurple2" => array(159, 121, 238),
"MediumPurple3" => array(137, 104, 205),
"MediumPurple4" => array( 93, 71, 139),
"thistle1" => array(255, 225, 255),
"thistle2" => array(238, 210, 238),
"thistle3" => array(205, 181, 205),
"thistle4" => array(139, 123, 139),
"gray0" => array( 0, 0, 0),
"grey0" => array( 0, 0, 0),
"gray1" => array( 3, 3, 3),
"grey1" => array( 3, 3, 3),
"gray2" => array( 5, 5, 5),
"grey2" => array( 5, 5, 5),
"gray3" => array( 8, 8, 8),
"grey3" => array( 8, 8, 8),
"gray4" => array( 10, 10, 10),
"grey4" => array( 10, 10, 10),
"gray5" => array( 13, 13, 13),
"grey5" => array( 13, 13, 13),
"gray6" => array( 15, 15, 15),
"grey6" => array( 15, 15, 15),
"gray7" => array( 18, 18, 18),
"grey7" => array( 18, 18, 18),
"gray8" => array( 20, 20, 20),
"grey8" => array( 20, 20, 20),
"gray9" => array( 23, 23, 23),
"grey9" => array( 23, 23, 23),
"gray10" => array( 26, 26, 26),
"grey10" => array( 26, 26, 26),
"gray11" => array( 28, 28, 28),
"grey11" => array( 28, 28, 28),
"gray12" => array( 31, 31, 31),
"grey12" => array( 31, 31, 31),
"gray13" => array( 33, 33, 33),
"grey13" => array( 33, 33, 33),
"gray14" => array( 36, 36, 36),
"grey14" => array( 36, 36, 36),
"gray15" => array( 38, 38, 38),
"grey15" => array( 38, 38, 38),
"gray16" => array( 41, 41, 41),
"grey16" => array( 41, 41, 41),
"gray17" => array( 43, 43, 43),
"grey17" => array( 43, 43, 43),
"gray18" => array( 46, 46, 46),
"grey18" => array( 46, 46, 46),
"gray19" => array( 48, 48, 48),
"grey19" => array( 48, 48, 48),
"gray20" => array( 51, 51, 51),
"grey20" => array( 51, 51, 51),
"gray21" => array( 54, 54, 54),
"grey21" => array( 54, 54, 54),
"gray22" => array( 56, 56, 56),
"grey22" => array( 56, 56, 56),
"gray23" => array( 59, 59, 59),
"grey23" => array( 59, 59, 59),
"gray24" => array( 61, 61, 61),
"grey24" => array( 61, 61, 61),
"gray25" => array( 64, 64, 64),
"grey25" => array( 64, 64, 64),
"gray26" => array( 66, 66, 66),
"grey26" => array( 66, 66, 66),
"gray27" => array( 69, 69, 69),
"grey27" => array( 69, 69, 69),
"gray28" => array( 71, 71, 71),
"grey28" => array( 71, 71, 71),
"gray29" => array( 74, 74, 74),
"grey29" => array( 74, 74, 74),
"gray30" => array( 77, 77, 77),
"grey30" => array( 77, 77, 77),
"gray31" => array( 79, 79, 79),
"grey31" => array( 79, 79, 79),
"gray32" => array( 82, 82, 82),
"grey32" => array( 82, 82, 82),
"gray33" => array( 84, 84, 84),
"grey33" => array( 84, 84, 84),
"gray34" => array( 87, 87, 87),
"grey34" => array( 87, 87, 87),
"gray35" => array( 89, 89, 89),
"grey35" => array( 89, 89, 89),
"gray36" => array( 92, 92, 92),
"grey36" => array( 92, 92, 92),
"gray37" => array( 94, 94, 94),
"grey37" => array( 94, 94, 94),
"gray38" => array( 97, 97, 97),
"grey38" => array( 97, 97, 97),
"gray39" => array( 99, 99, 99),
"grey39" => array( 99, 99, 99),
"gray40" => array(102, 102, 102),
"grey40" => array(102, 102, 102),
"gray41" => array(105, 105, 105),
"grey41" => array(105, 105, 105),
"gray42" => array(107, 107, 107),
"grey42" => array(107, 107, 107),
"gray43" => array(110, 110, 110),
"grey43" => array(110, 110, 110),
"gray44" => array(112, 112, 112),
"grey44" => array(112, 112, 112),
"gray45" => array(115, 115, 115),
"grey45" => array(115, 115, 115),
"gray46" => array(117, 117, 117),
"grey46" => array(117, 117, 117),
"gray47" => array(120, 120, 120),
"grey47" => array(120, 120, 120),
"gray48" => array(122, 122, 122),
"grey48" => array(122, 122, 122),
"gray49" => array(125, 125, 125),
"grey49" => array(125, 125, 125),
"gray50" => array(127, 127, 127),
"grey50" => array(127, 127, 127),
"gray51" => array(130, 130, 130),
"grey51" => array(130, 130, 130),
"gray52" => array(133, 133, 133),
"grey52" => array(133, 133, 133),
"gray53" => array(135, 135, 135),
"grey53" => array(135, 135, 135),
"gray54" => array(138, 138, 138),
"grey54" => array(138, 138, 138),
"gray55" => array(140, 140, 140),
"grey55" => array(140, 140, 140),
"gray56" => array(143, 143, 143),
"grey56" => array(143, 143, 143),
"gray57" => array(145, 145, 145),
"grey57" => array(145, 145, 145),
"gray58" => array(148, 148, 148),
"grey58" => array(148, 148, 148),
"gray59" => array(150, 150, 150),
"grey59" => array(150, 150, 150),
"gray60" => array(153, 153, 153),
"grey60" => array(153, 153, 153),
"gray61" => array(156, 156, 156),
"grey61" => array(156, 156, 156),
"gray62" => array(158, 158, 158),
"grey62" => array(158, 158, 158),
"gray63" => array(161, 161, 161),
"grey63" => array(161, 161, 161),
"gray64" => array(163, 163, 163),
"grey64" => array(163, 163, 163),
"gray65" => array(166, 166, 166),
"grey65" => array(166, 166, 166),
"gray66" => array(168, 168, 168),
"grey66" => array(168, 168, 168),
"gray67" => array(171, 171, 171),
"grey67" => array(171, 171, 171),
"gray68" => array(173, 173, 173),
"grey68" => array(173, 173, 173),
"gray69" => array(176, 176, 176),
"grey69" => array(176, 176, 176),
"gray70" => array(179, 179, 179),
"grey70" => array(179, 179, 179),
"gray71" => array(181, 181, 181),
"grey71" => array(181, 181, 181),
"gray72" => array(184, 184, 184),
"grey72" => array(184, 184, 184),
"gray73" => array(186, 186, 186),
"grey73" => array(186, 186, 186),
"gray74" => array(189, 189, 189),
"grey74" => array(189, 189, 189),
"gray75" => array(191, 191, 191),
"grey75" => array(191, 191, 191),
"gray76" => array(194, 194, 194),
"grey76" => array(194, 194, 194),
"gray77" => array(196, 196, 196),
"grey77" => array(196, 196, 196),
"gray78" => array(199, 199, 199),
"grey78" => array(199, 199, 199),
"gray79" => array(201, 201, 201),
"grey79" => array(201, 201, 201),
"gray80" => array(204, 204, 204),
"grey80" => array(204, 204, 204),
"gray81" => array(207, 207, 207),
"grey81" => array(207, 207, 207),
"gray82" => array(209, 209, 209),
"grey82" => array(209, 209, 209),
"gray83" => array(212, 212, 212),
"grey83" => array(212, 212, 212),
"gray84" => array(214, 214, 214),
"grey84" => array(214, 214, 214),
"gray85" => array(217, 217, 217),
"grey85" => array(217, 217, 217),
"gray86" => array(219, 219, 219),
"grey86" => array(219, 219, 219),
"gray87" => array(222, 222, 222),
"grey87" => array(222, 222, 222),
"gray88" => array(224, 224, 224),
"grey88" => array(224, 224, 224),
"gray89" => array(227, 227, 227),
"grey89" => array(227, 227, 227),
"gray90" => array(229, 229, 229),
"grey90" => array(229, 229, 229),
"gray91" => array(232, 232, 232),
"grey91" => array(232, 232, 232),
"gray92" => array(235, 235, 235),
"grey92" => array(235, 235, 235),
"gray93" => array(237, 237, 237),
"grey93" => array(237, 237, 237),
"gray94" => array(240, 240, 240),
"grey94" => array(240, 240, 240),
"gray95" => array(242, 242, 242),
"grey95" => array(242, 242, 242),
"gray96" => array(245, 245, 245),
"grey96" => array(245, 245, 245),
"gray97" => array(247, 247, 247),
"grey97" => array(247, 247, 247),
"gray98" => array(250, 250, 250),
"grey98" => array(250, 250, 250),
"gray99" => array(252, 252, 252),
"grey99" => array(252, 252, 252),
"gray100" => array(255, 255, 255)
);
deviceInit('/dev/ttyGW',9600,'none',8,2,'none');
// Open port
$modbus->deviceOpen();
// Enable debug
$modbus->debug = $debug;
# read registers 0-224 in groups of 15
$regnos = array(); #Register Numbers 0-224
#0 to 16
$startingaddress = str_pad(dechex(0), 4, "0", STR_PAD_LEFT);
//echo "\n$startingaddress\t";
$Numberofpoints = str_pad(dechex(30), 4, "0", STR_PAD_LEFT);
//echo "\n$Numberofpoints\n";
$result=$modbus->sendQuery(1,3,"$startingaddress", 30);
if($debug) print_r($result);
echo "\n";
$air = array('Standby','PV and Grid Combined Discharge','Discharge','Fault','Flash','PV charge','AC charge','Combine charge','Combine charge and Bypass','PV charge and Bypass','AC charge and Bypass','Bypass','PV charge and Discharge');
//for($i=0; $i < 13; $i++) { echo "$i $air[$i]\n"; };
for($i=0; $i < 60; $i+=2) {
$j = $i+1;
$register = str_pad($i,3," ", STR_PAD_LEFT);
$register = $register/2;
$hex = $result[$i].$result[$j];
$dec = hexdec($hex);
$dectenth = $dec/10;
if ($i<19) echo " ",$register," ", 'hex Word ', $hex;
if ($i>18) echo $register," ", 'hex Word ', $hex;
if ($register==0) echo "\tGrowatt ??00=standby, 01??=AC output disable";
if ($register==1) echo "\tAC Output first prioroty 0=Bat 1=PV 2=Uti 3=PV&Uti";
if ($register==2) echo "\tCharge Source set 0:PV_first 1:PV&Uti 2:PV_Only";
if ($register==3) echo "\tUti Output Start time (0-23)= $dec";
if ($register==4) echo "\tUti Output End Timer (0-23)= $dec";
if ($register==5) echo "\tUti Charge Start Time (0-23)= $dec";
if ($register==6) echo "\tUti Charge End Time (0-23)= $dec";
if ($register==7) echo "\tPV Input Mode W 0:Independent 1:Parallel= $dec";
if ($register==8) echo "\tAC Input Mode VAC 0:APL_90-140 1:UPS_65-140 2:Generator";
if ($register==9) echo "\tFirmware version High";
if ($register==10) echo "\tFirmware version Mid";
if ($register==11) echo "\tFirmware version Low";
if ($register==12) echo "\tControl Firmware version High";
if ($register==13) echo "\tControl Firmware version Mid";
if ($register==14) echo "\tControl Firmware version Low";
if ($register==15) echo "\tLCD Language";
if ($register==16) echo "\tGridV_Adj";
if ($register==17) echo "\tInvV_Adj";
if ($register==18) echo "\tOutputVoltType 6:120VAC";
if ($register==19) echo "\tOutputFreqType 1:60 Hz";
if ($register==20) {
$hr20 = file_get_contents("hr20.txt");
echo "\tOverLoadRestart 0:Yes 1:No 2:Switch to Uti. Was ",$hr20;
$hr20=$hex;
$hr20 = trim($hr20, " \n\r\t\v\x00");
file_put_contents("hr20.txt",$hr20);
}
if ($register==21) {
$hr21 = file_get_contents("hr21.txt");
echo "\tOverTemperatureRestart 0:Yes 1:No. Was ",$hr21;
$hr21 = $hex;
$hr21 = trim($hr21, " \n\r\t\v\x00");
file_put_contents("hr21.txt",$hr21);
}
if ($register==22) echo "\tBuzzer 1:Enable 0:Disable";
if ($register==23) echo "\tSerial No. 5";
if ($register==24) echo "\tSerial No. 4";
if ($register==25) echo "\tSerial No. 3";
if ($register==26) echo "\tSerial No. 2";
if ($register==27) echo "\tSerial No. 1";
if ($register==28) echo "\tInverter Module high";
if ($register==29) echo "\tInverter Module low ";
if ($register==30) echo "\tCommunication Address";
if ($register==31) echo "\tFlashStart 1:Own 100:control_board";
echo chr(10);
$regnos[] = $result[$i] . $result[$j];
}
$modbus->deviceClose();
?>
deviceInit('/dev/ttyGW',9600,'none',8,2,'none');
//print_r($modbus);
//sleep(9);
// Open port
$modbus->deviceOpen();
//print_r($modbus);
//sleep(9);
// Enable debug
$modbus->debug = $debug;
# read registers 0-162
$regnos = array(); #Register Numbers 0-162
$startingaddress = str_pad(dechex(16), 4, "0", STR_PAD_LEFT); echo "\n$startingaddress\n";
echo "starting address = $startingaddress \n";
$Numberofpoints = str_pad(dechex(16), 4, "0", STR_PAD_LEFT); echo "\n$Numberofpoints\n";
$result=$modbus->sendQuery(1,3,"$startingaddress", 16);
if($debug) print_r($result);
//print ("1,3,$startingaddress,15");
//print_r($result);
//sleep(9);
for($i=16; $i < 48; $i+=2) {
$j = $i+1;
echo $i/2+16, 'Word = ', $result[$i] . $result[$j], chr(10); $regnos[] = $result[$i] . $result[$j]; } #echo "
print_r regnos"; #print_r($regnos); $modbus->deviceClose(); ?> deviceInit('/dev/ttyGW',9600,'none',8,2,'none'); //print_r($modbus); //sleep(9); // Open port $modbus->deviceOpen(); //print_r($modbus); //sleep(9); // Enable debug $modbus->debug = $debug; # read registers 0-162 $regnos = array(); #Register Numbers 0-162 $startingaddress = str_pad(dechex(0), 4, "0", STR_PAD_LEFT); echo "\n$startingaddress\n"; echo "starting address = $startingaddress \n"; $Numberofpoints = str_pad(dechex(16), 4, "0", STR_PAD_LEFT); echo "\n$Numberofpoints\n"; $result=$modbus->sendQuery(1,3,"$startingaddress", 32); if($debug) print_r($result); //print ("1,3,$startingaddress,15"); //print_r($result); //sleep(9); for($i=0; $i < 64; $i+=2) { $j = $i+1; #echo $i/2+8, '
Word = ', $result[$i] . $result[$j], chr(10); $regnos[] = $result[$i] . $result[$j]; } echo "
print_r regnos"; print_r($regnos); $modbus->deviceClose(); ?> deviceInit('/dev/ttyGW',9600,'none',8,2,'none'); // Open port $modbus->deviceOpen(); // Enable debug $modbus->debug = $debug; # read registers 0-224 in groups of 15 $regnos = array(); #Register Numbers 0-224 #0 to 16 $startingaddress = str_pad(dechex(120), 4, "0", STR_PAD_LEFT); //echo "\n$startingaddress\t"; $Numberofpoints = str_pad(dechex(30), 4, "0", STR_PAD_LEFT); //echo "\n$Numberofpoints\n"; $result=$modbus->sendQuery(1,3,"$startingaddress", 30); if($debug) print_r($result); echo "
Read Input Registers
";
echo "\n";
$air = array('Standby','PV and Grid Combined Discharge','Discharge','Fault','Flash','PV charge','AC charge','Combine charge','Combine charge and Bypass','PV charge and Bypass','AC charge and Bypass','Bypass','PV charge and Discharge');
//for($i=0; $i < 13; $i++) {  echo "$i $air[$i]\n"; };
for($i=0; $i < 60; $i+=2) {
    $j = $i+1;
    $register = str_pad($i+240,3," ", STR_PAD_LEFT);
    $register = $register/2;
    $hex = $result[$i].$result[$j];
    $dec = hexdec($hex);
    $dectenth = $dec/10;
    echo " ",$register," ", 'hex Word ', $hex;
    if ($register==90) echo "\tNomOpFreq $dectenth";
    if ($register==91) echo "\tNomOpPow $dec";
    if ($register==2) echo "\tCharge Source set 0:PV_first 1:PV&Uti 2:PV_Only";
#    if ($register==3) echo "\tPV1 Power high";
    if ($register==94) echo "\tuwBatCutOffVolt $dectenth";
    if ($register==95) echo "\tAC switch to Battery $dectenth";
#    if ($register==6) echo "\tPV2 N/A";
#    if ($register==7) echo "\tBuck1 current $dectenth Amperes";
    if ($register==8) echo "\tAC Input Mode VAC 0:APL_90-140 1:UPS_65-140 2:Generator";
    if ($register==9) echo "\tFirmware version High";
    if ($register==10) echo "\tFirmware version Mid";
    if ($register==11) echo "\tFirmware version Low";
    if ($register==12) echo "\tControl Firmware version High";
    if ($register==13) echo "\tControl Firmware version Mid";
    if ($register==14) echo "\tControl Firmware version Low";
    if ($register==15) echo "\tLCD Language";
    if ($register==16) echo "\tGridV_Adj";
    if ($register==77) echo "\tRate 3000 watts? $dectenth";
    if ($register==79) echo "\tRate 3000 va? $dectenth";
    if ($register==84) echo "\tNomGridVolt $dectenth";
    if ($register==85) echo "\tNomGridFreq $dectenth";
    if ($register==86) echo "\tNomBatVolt $dectenth";
    if ($register==87) echo "\tNomPvCurr $dectenth";
    if ($register==88) echo "\tNomAcChgCurr $dectenth";
    if ($register==89) echo "\tNomOpVolt $dectenth";
    echo chr(10);
    $regnos[] = $result[$i] . $result[$j];
}
echo "
\n";
$modbus->deviceClose();
?>
deviceInit('/dev/ttyGW',9600,'none',8,2,'none');
// Open port
$modbus->deviceOpen();
// Enable debug
$modbus->debug = $debug;
# read registers 0-224 in groups of 15
$regnos = array(); #Register Numbers 0-224
#0 to 16
$startingaddress = str_pad(dechex(150), 4, "0", STR_PAD_LEFT);
//echo "\n$startingaddress\t";
$Numberofpoints = str_pad(dechex(30), 4, "0", STR_PAD_LEFT);
//echo "\n$Numberofpoints\n";
$result=$modbus->sendQuery(1,3,"$startingaddress", 30);
if($debug) print_r($result);
echo "Read Input Registers
";
echo "\n";
$air = array('Standby','PV and Grid Combined Discharge','Discharge','Fault','Flash','PV charge','AC charge','Combine charge','Combine charge and Bypass','PV charge and Bypass','AC charge and Bypass','Bypass','PV charge and Discharge');
//for($i=0; $i < 13; $i++) {  echo "$i $air[$i]\n"; };
for($i=0; $i < 60; $i+=2) {
    $j = $i+1;
    $register = str_pad($i+300,3," ", STR_PAD_LEFT);
    $register = $register/2;
    $hex = $result[$i].$result[$j];
    $dec = hexdec($hex);
    $dectenth = $dec/10;
    echo " ",$register," ", 'hex Word ', $hex;
    if ($register==90) echo "\tNomOpFreq $dectenth";
    if ($register==91) echo "\tNomOpPow $dec";
    if ($register==2) echo "\tCharge Source set 0:PV_first 1:PV&Uti 2:PV_Only";
#    if ($register==3) echo "\tPV1 Power high";
    if ($register==94) echo "\tuwBatCutOffVolt $dectenth";
    if ($register==95) echo "\tAC switch to Battery $dectenth";
#    if ($register==6) echo "\tPV2 N/A";
#    if ($register==7) echo "\tBuck1 current $dectenth Amperes";
    if ($register==8) echo "\tAC Input Mode VAC 0:APL_90-140 1:UPS_65-140 2:Generator";
    if ($register==9) echo "\tFirmware version High";
    if ($register==10) echo "\tFirmware version Mid";
    if ($register==11) echo "\tFirmware version Low";
    if ($register==12) echo "\tControl Firmware version High";
    if ($register==13) echo "\tControl Firmware version Mid";
    if ($register==14) echo "\tControl Firmware version Low";
    if ($register==15) echo "\tLCD Language";
    if ($register==16) echo "\tGridV_Adj";
    if ($register==77) echo "\tRate 3000 watts? $dectenth";
    if ($register==79) echo "\tRate 3000 va? $dectenth";
    if ($register==84) echo "\tNomGridVolt $dectenth";
    if ($register==85) echo "\tNomGridFreq $dectenth";
    if ($register==86) echo "\tNomBatVolt $dectenth";
    if ($register==87) echo "\tNomPvCurr $dectenth";
    if ($register==88) echo "\tNomAcChgCurr $dectenth";
    if ($register==89) echo "\tNomOpVolt $dectenth";
    echo chr(10);
    $regnos[] = $result[$i] . $result[$j];
}
echo "
\n";
$modbus->deviceClose();
?>
deviceInit('/dev/ttyGW',9600,'none',8,2,'none');
// Open port
$modbus->deviceOpen();
// Enable debug
$modbus->debug = $debug;
# read registers 0-224 in groups of 15
$regnos = array(); #Register Numbers 0-224
#0 to 14
$startingaddress = str_pad(dechex(16), 4, "0", STR_PAD_LEFT);
//echo "\n$startingaddress\t";
$Numberofpoints = str_pad(dechex(16), 4, "0", STR_PAD_LEFT);
//echo "\n$Numberofpoints\n";
$result=$modbus->sendQuery(1,3,"$startingaddress", 16);
if($debug) print_r($result);
echo "Read Input Registers
\n";
for($i=0; $i < 32; $i+=2) {
    $j = $i+1;
    $register = $i/2;
    $register = str_pad($register+16,3," ", STR_PAD_LEFT);
    $hex = $result[$i].$result[$j];
    $lineout = "hex $register\tword ".$hex; echo $lineout;
    //echo " hex Word  $hex \tdecimal ", hexdec($hex);
    if ($register==16) echo "\tGridV-Adj";
    if ($register==17) echo "\tInvV_Adj";
    if ($register==18) echo "\tOutputVoltType 6:120VAC";
    if ($register==19) echo "\tOutputFreqType 1:60 Hz";
    if ($register==20) echo "\tOverLoadRestart 0:Yes 1:No 2:Switch to Uti";
    if ($register==21) echo "\tOverTemperatureRestart 0:Yes 1:No";
    if ($register==22) echo "\tBuzzer 1:Enable 0:Disable";
    if ($register==23) echo "\tSerial No. 5";
    if ($register==24) echo "\tSerial No. 4";
    if ($register==25) echo "\tSerial No. 3";
    if ($register==26) echo "\tSerial No. 2";
    if ($register==27) echo "\tSerial No. 1";
    if ($register==28) echo "\tInverter Module high";
    if ($register==29) echo "\tInverter Module low ";
    if ($register==30) echo "\tCommunication Address";
    if ($register==31) echo "\tFlashStart 1:Own 100:control_board";
    echo chr(10);
    $regnos[] = $result[$i] . $result[$j];
}
echo "
\n";
$modbus->deviceClose();
?>
deviceInit('/dev/ttyGW',9600,'none',8,2,'none');
//print_r($modbus);
//sleep(9);
// Open port
$modbus->deviceOpen();
//print_r($modbus);
//sleep(9);
// Enable debug
$modbus->debug = $debug;
# read registers 0-162
$regnos = array(); #Register Numbers 0-162
$startingaddress = str_pad(dechex(8), 4, "0", STR_PAD_LEFT); echo "\n$startingaddress\n";
echo "starting address = $startingaddress \n";
$Numberofpoints = str_pad(dechex(15), 4, "0", STR_PAD_LEFT); echo "\n$Numberofpoints\n";
$result=$modbus->sendQuery(1,3,"$startingaddress", 15);
if($debug) print_r($result);
//print ("1,3,$startingaddress,15");
//print_r($result);
//sleep(9);
for($i=0; $i < 30; $i+=2) {
$j = $i+1;
echo $i/2+8, 'Word = ', $result[$i] . $result[$j], chr(10); $regnos[] = $result[$i] . $result[$j]; } //echo "print_r regnos"; //print_r($regnos); $modbus->deviceClose(); ?> deviceInit('/dev/ttyGW',9600,'none',8,2,'none'); //print_r($modbus); //sleep(9); // Open port $modbus->deviceOpen(); //print_r($modbus); //sleep(9); // Enable debug $modbus->debug = $debug; # read registers 0-162 $regnos = array(); #Register Numbers 0-162 $startingaddress = str_pad(dechex(16), 4, "0", STR_PAD_LEFT); echo "\n$startingaddress\n"; echo "starting address = $startingaddress \n"; $Numberofpoints = str_pad(dechex(15), 4, "0", STR_PAD_LEFT); echo "\n$Numberofpoints\n"; $result=$modbus->sendQuery(1,3,"$startingaddress", 15); if($debug) print_r($result); //print ("1,3,$startingaddress,15"); //print_r($result); //sleep(9); for($i=0; $i < 30; $i+=2) { $j = $i+1; echo $i/2+16, '
Word = ', $result[$i] . $result[$j], chr(10); $regnos[] = $result[$i] . $result[$j]; } //echo "print_r regnos"; //print_r($regnos); $modbus->deviceClose(); ?> deviceInit('/dev/ttyGW',9600,'none',8,2,'none'); // Open port $modbus->deviceOpen(); // Enable debug $modbus->debug = $debug; # read registers 0-224 in groups of 15 $regnos = array(); #Register Numbers 0-224 #0 to 16 $startingaddress = str_pad(dechex(30), 4, "0", STR_PAD_LEFT); //echo "\n$startingaddress\t"; $Numberofpoints = str_pad(dechex(30), 4, "0", STR_PAD_LEFT); //echo "\n$Numberofpoints\n"; $result=$modbus->sendQuery(1,3,"$startingaddress", 30); if($debug) print_r($result); echo "\n"; $air = array('Standby','PV and Grid Combined Discharge','Discharge','Fault','Flash','PV charge','AC charge','Combine charge','Combine charge and Bypass','PV charge and Bypass','AC charge and Bypass','Bypass','PV charge and Discharge'); //for($i=0; $i < 13; $i++) { echo "$i $air[$i]\n"; }; for($i=0; $i < 60; $i+=2) { $j = $i+1; $register = str_pad($i+60,3," ", STR_PAD_LEFT); $register = $register/2; $hex = $result[$i].$result[$j]; $dec = hexdec($hex); $dectenth = $dec/10; echo " ",$register," ", 'hex Word ', $hex; if ($register==30) echo "\tComm Address= $dec"; if ($register==31) echo "\tUpdate firmware 1:Own 100:control_board"; if ($register==32) echo "\tReset User Information 1"; if ($register==33) echo "\tReset to factory"; if ($register==34) echo "\tMaxChargeCurr= $dec"; if ($register==35) echo "\tBulkChargeVolt= $dectenth"; if ($register==36) echo "\tFloatChargeVolt= $dectenth"; if ($register==37) echo "\tBatLowToUtiVolt= $dectenth"; if ($register==38) echo "\tACChargeCurr= $dec amperes"; if ($register==39) echo "\tBattery Type 2:USE 4:USE2"; if ($register==40) echo "\tAging Mode"; if ($register==41) echo "\tUnknown"; if ($register==42) echo "\tUnknown"; if ($register==43) echo "\tDevice Type Code"; if ($register==44) echo "\tUnknown"; if ($register==45) echo "\tSystem Time Year $dec"; if ($register==46) echo "\tSystem Time Month $dec"; if ($register==47) echo "\tSystem Time Day $dec"; if ($register==48) echo "\tSystem Time Hour $dec"; if ($register==49) echo "\tSystem Time Min $dec"; if ($register==50) echo "\tSystem Time Sec $dec"; if ($register==51) echo "\tBlank"; if ($register==52) echo "\tuwAcVoltHighL"; if ($register==53) echo "\tuwAcVoltLowL"; if ($register==54) echo "\tuwAcFreqHighL"; if ($register==55) echo "\tuwAcFreqLowL"; if ($register==56) echo "\tBlank"; if ($register==57) echo "\tBlank"; if ($register==58) echo "\tBlank"; if ($register==59) echo "\tManufacturer information 8"; echo chr(10); $regnos[] = $result[$i] . $result[$j]; } $modbus->deviceClose(); ?> deviceInit('/dev/ttyGW',9600,'none',8,2,'none'); // Open port $modbus->deviceOpen(); // Enable debug $modbus->debug = $debug; # read registers 0-224 in groups of 15 $regnos = array(); #Register Numbers 0-224 #0 to 14 $startingaddress = str_pad(dechex(32), 4, "0", STR_PAD_LEFT); //echo "\n$startingaddress\t"; $Numberofpoints = str_pad(dechex(16), 4, "0", STR_PAD_LEFT); //echo "\n$Numberofpoints\n"; $result=$modbus->sendQuery(1,3,"$startingaddress", 16); if($debug) print_r($result); echo "
Read Input Registers
\n";
for($i=0; $i < 32; $i+=2) {
    $j = $i+1;
    $register = $i/2;
    $register = str_pad($register+32,3," ", STR_PAD_LEFT);
    $hex = $result[$i].$result[$j];
    $dec = hexdec($hex);
    $dectenth = $dec/10;
    echo $register," ", 'hex Word ', $hex," decimal ", hexdec($hex);
#    $lineout = "hex $register\tword ".$hex; echo $lineout;
    //echo " hex Word  $hex \tdecimal ", hexdec($hex);
    if ($register==32) echo "\tHR 32";
    if ($register==33) echo "\tHR 33";
    if ($register==34) echo "\tMaxChargeCurr";
    if ($register==35) echo "\tBulkChargeVolt $dectenth";
    if ($register==36) echo "\tFloatChargeVolt $dectenth";
    if ($register==37) echo "\tBatLowToUtiVolt $dectenth";
    if ($register==38) echo "\tACChargeCurr";
    if ($register==39) echo "\tBattery Type 4:USE2";
    if ($register==40) echo "\tAging Mode";
    if ($register==41) echo "\tUnknown";
    if ($register==42) echo "\tUnknown";
    if ($register==43) echo "\tDevice Type Code";
    if ($register==44) echo "\tUnknown";
    if ($register==45) echo "\tSystem Time Year";
    if ($register==46) echo "\tSsytem Time Month";
    if ($register==47) echo "\tSystem Time Day";
    echo chr(10);
    $regnos[] = $result[$i] . $result[$j];
}
echo "
\n";
$modbus->deviceClose();
?>
deviceInit('/dev/ttyGW',9600,'none',8,2,'none');
//print_r($modbus);
//sleep(9);
// Open port
$modbus->deviceOpen();
//print_r($modbus);
//sleep(9);
// Enable debug
$modbus->debug = $debug;
# read registers 0-162
$regnos = array(); #Register Numbers 0-162
$startingaddress = str_pad(dechex(24), 4, "0", STR_PAD_LEFT); echo "\n$startingaddress\n";
echo "starting address = $startingaddress \n";
$Numberofpoints = str_pad(dechex(15), 4, "0", STR_PAD_LEFT); echo "\n$Numberofpoints\n";
$result=$modbus->sendQuery(1,3,"$startingaddress", 15);
if($debug) print_r($result);
//print ("1,3,$startingaddress,15");
//print_r($result);
//sleep(9);
for($i=0; $i < 30; $i+=2) {
$j = $i+1;
echo $i/2+24, 'Word = ', $result[$i] . $result[$j], chr(10); $regnos[] = $result[$i] . $result[$j]; } //echo "print_r regnos"; //print_r($regnos); $modbus->deviceClose(); ?> deviceInit('/dev/ttyGW',9600,'none',8,2,'none'); // Open port $modbus->deviceOpen(); // Enable debug $modbus->debug = $debug; # read registers 0-224 in groups of 15 $regnos = array(); #Register Numbers 0-224 #0 to 14 $startingaddress = str_pad(dechex(48), 4, "0", STR_PAD_LEFT); //echo "\n$startingaddress\t"; $Numberofpoints = str_pad(dechex(16), 4, "0", STR_PAD_LEFT); //echo "\n$Numberofpoints\n"; $result=$modbus->sendQuery(1,3,"$startingaddress", 16); if($debug) print_r($result); echo "
Read Input Registers
\n";
for($i=0; $i < 32; $i+=2) {
    $j = $i+1;
    $register = $i/2;
    $register = str_pad($register+48,3," ", STR_PAD_LEFT);
    $hex = $result[$i].$result[$j];
    $dec = hexdec($hex);
    $dectenth = $dec/10;
    echo $register," ", 'hex Word ', $hex," decimal ", hexdec($hex);
#    $lineout = "hex $register\tword ".$hex; echo $lineout;
    //echo " hex Word  $hex \tdecimal ", hexdec($hex);
    if ($register==48) echo "\tHR 48";
    if ($register==49) echo "\tHR 49";
    if ($register==50) echo "\tMaxChargeCurr";
    if ($register==51) echo "\tBulkChargeVolt $dectenth";
    if ($register==52) echo "\tFloatChargeVolt $dectenth";
    if ($register==53) echo "\tBatLowToUtiVolt $dectenth";
    if ($register==54) echo "\tACChargeCurr";
    if ($register==55) echo "\tBattery Type 4:USE2";
    if ($register==56) echo "\tAging Mode";
    if ($register==57) echo "\tUnknown";
    if ($register==58) echo "\tUnknown";
    if ($register==59) echo "\tDevice Type Code";
    if ($register==60) echo "\tUnknown";
    if ($register==61) echo "\tSystem Time Year";
    if ($register==62) echo "\tSsytem Time Month";
    if ($register==63) echo "\tSystem Time Day";
    echo chr(10);
    $regnos[] = $result[$i] . $result[$j];
}
echo "
\n";
$modbus->deviceClose();
?>
deviceInit('/dev/ttyGW',9600,'none',8,2,'none');
//print_r($modbus);
//sleep(9);
// Open port
$modbus->deviceOpen();
//print_r($modbus);
//sleep(9);
// Enable debug
$modbus->debug = $debug;
# read registers 0-162
$regnos = array(); #Register Numbers 0-162
$startingaddress = str_pad(dechex(32), 4, "0", STR_PAD_LEFT); echo "\n$startingaddress\n";
echo "starting address = $startingaddress \n";
$Numberofpoints = str_pad(dechex(15), 4, "0", STR_PAD_LEFT); echo "\n$Numberofpoints\n";
$result=$modbus->sendQuery(1,3,"$startingaddress", 15);
if($debug) print_r($result);
//print ("1,3,$startingaddress,15");
//print_r($result);
//sleep(9);
for($i=0; $i < 30; $i+=2) {
$j = $i+1;
echo $i/2+32, 'Word = ', $result[$i] . $result[$j], chr(10); $regnos[] = $result[$i] . $result[$j]; } //echo "print_r regnos"; //print_r($regnos); $modbus->deviceClose(); ?> deviceInit('/dev/ttyGW',9600,'none',8,2,'none'); //print_r($modbus); //sleep(9); // Open port $modbus->deviceOpen(); //print_r($modbus); //sleep(9); // Enable debug $modbus->debug = $debug; # read registers 0-162 $regnos = array(); #Register Numbers 0-162 $startingaddress = str_pad(dechex(40), 4, "0", STR_PAD_LEFT); echo "\n$startingaddress\n"; echo "starting address = $startingaddress \n"; $Numberofpoints = str_pad(dechex(15), 4, "0", STR_PAD_LEFT); echo "\n$Numberofpoints\n"; $result=$modbus->sendQuery(1,3,"$startingaddress", 15); if($debug) print_r($result); //print ("1,3,$startingaddress,15"); //print_r($result); //sleep(9); for($i=0; $i < 30; $i+=2) { $j = $i+1; echo $i/2+40, '
Word = ', $result[$i] . $result[$j], chr(10); $regnos[] = $result[$i] . $result[$j]; } //echo "print_r regnos"; //print_r($regnos); $modbus->deviceClose(); ?> deviceInit('/dev/ttyGW',9600,'none',8,2,'none'); // Open port $modbus->deviceOpen(); // Enable debug $modbus->debug = $debug; # read registers 0-224 in groups of 15 $regnos = array(); #Register Numbers 0-224 #0 to 16 $startingaddress = str_pad(dechex(60), 4, "0", STR_PAD_LEFT); //echo "\n$startingaddress\t"; $Numberofpoints = str_pad(dechex(30), 4, "0", STR_PAD_LEFT); //echo "\n$Numberofpoints\n"; $result=$modbus->sendQuery(1,3,"$startingaddress", 30); if($debug) print_r($result); echo "\n"; $air = array('Standby','PV and Grid Combined Discharge','Discharge','Fault','Flash','PV charge','AC charge','Combine charge','Combine charge and Bypass','PV charge and Bypass','AC charge and Bypass','Bypass','PV charge and Discharge'); //for($i=0; $i < 13; $i++) { echo "$i $air[$i]\n"; }; for($i=0; $i < 60; $i+=2) { $j = $i+1; $register = str_pad($i+120,3," ", STR_PAD_LEFT); $register = $register/2; $hex = $result[$i].$result[$j]; $dec = hexdec($hex); $dectenth = $dec/10; echo " ",$register," ", 'hex Word ', $hex; if ($register==60) echo "\tManufacturer information 7"; if ($register==61) echo "\tManufacturer information 6"; if ($register==62) echo "\tManufacturer information 5"; if ($register==63) echo "\tManufacturer information 4"; if ($register==64) echo "\tManufacturer information 3"; if ($register==65) echo "\tManufacturer information 2"; if ($register==66) echo "\tManufacturer information 1"; if ($register==67) echo "\tControl FW Build 2"; if ($register==68) echo "\tControl FW Build 1"; if ($register==69) echo "\tCom FW Build 2"; if ($register==70) echo "\tCom FW Build 1"; if ($register==71) echo "\tBlank"; if ($register==72) echo "\tSys Weekly"; if ($register==73) echo "\tModbus Version"; if ($register==74) echo "\tBlank"; if ($register==75) echo "\tBlank"; if ($register==76) echo "\tRate active power high"; if ($register==77) echo "\tRate active power low= $dectenth"; if ($register==78) echo "\tRate apparent power high?= $dectenth"; if ($register==79) echo "\tRate apparent power low?= $dectenth"; if ($register==80) echo "\tFactory ODM Info code= $dec"; if ($register==81) echo "\tuwBatPieceNum= $dec"; if ($register==82) echo "\tCutoff value voltage= $dectenth"; if ($register==83) echo "\tBlank"; if ($register==84) echo "\tNomGridVolt $dectenth"; if ($register==85) echo "\tNomGridFreq $dectenth"; if ($register==86) echo "\tNomBatVolt $dectenth"; if ($register==87) echo "\tNomPvCurr $dectenth"; if ($register==88) echo "\tNomAcChgCurr $dectenth"; if ($register==89) echo "\tNomOpVolt $dectenth"; echo chr(10); $regnos[] = $result[$i] . $result[$j]; } $modbus->deviceClose(); ?> deviceInit('/dev/ttyGW',9600,'none',8,2,'none'); //print_r($modbus); //sleep(9); // Open port $modbus->deviceOpen(); //print_r($modbus); //sleep(9); // Enable debug $modbus->debug = $debug; # read registers 0-162 $regnos = array(); #Register Numbers 0-162 $startingaddress = str_pad(dechex(48), 4, "0", STR_PAD_LEFT); echo "\n$startingaddress\n"; echo "starting address = $startingaddress \n"; $Numberofpoints = str_pad(dechex(15), 4, "0", STR_PAD_LEFT); echo "\n$Numberofpoints\n"; $result=$modbus->sendQuery(1,3,"$startingaddress", 15); if($debug) print_r($result); //print ("1,3,$startingaddress,15"); //print_r($result); //sleep(9); for($i=0; $i < 30; $i+=2) { $j = $i+1; echo $i/2+48, '
Word = ', $result[$i] . $result[$j], chr(10); $regnos[] = $result[$i] . $result[$j]; } //echo "print_r regnos"; //print_r($regnos); $modbus->deviceClose(); ?> deviceInit('/dev/ttyGW',9600,'none',8,2,'none'); //print_r($modbus); //sleep(9); // Open port $modbus->deviceOpen(); //print_r($modbus); //sleep(9); // Enable debug $modbus->debug = $debug; # read registers 0-162 $regnos = array(); #Register Numbers 0-162 $startingaddress = str_pad(dechex(56), 4, "0", STR_PAD_LEFT); echo "\n$startingaddress\n"; echo "starting address = $startingaddress \n"; $Numberofpoints = str_pad(dechex(15), 4, "0", STR_PAD_LEFT); echo "\n$Numberofpoints\n"; $result=$modbus->sendQuery(1,3,"$startingaddress", 15); if($debug) print_r($result); //print ("1,3,$startingaddress,15"); //print_r($result); //sleep(9); for($i=0; $i < 30; $i+=2) { $j = $i+1; echo $i/2+56, '
Word = ', $result[$i] . $result[$j], chr(10); $regnos[] = $result[$i] . $result[$j]; } //echo "print_r regnos"; //print_r($regnos); $modbus->deviceClose(); ?> deviceInit('/dev/ttyGW',9600,'none',8,2,'none'); //print_r($modbus); //sleep(9); // Open port $modbus->deviceOpen(); //print_r($modbus); //sleep(9); // Enable debug $modbus->debug = $debug; # read registers 0-162 $regnos = array(); #Register Numbers 0-162 $startingaddress = str_pad(dechex(64), 4, "0", STR_PAD_LEFT); echo "\n$startingaddress\n"; echo "starting address = $startingaddress \n"; $Numberofpoints = str_pad(dechex(15), 4, "0", STR_PAD_LEFT); echo "\n$Numberofpoints\n"; $result=$modbus->sendQuery(1,3,"$startingaddress", 15); if($debug) print_r($result); //print ("1,3,$startingaddress,15"); //print_r($result); //sleep(9); for($i=0; $i < 30; $i+=2) { $j = $i+1; echo $i/2+64, '
Word = ', $result[$i] . $result[$j], chr(10); $regnos[] = $result[$i] . $result[$j]; } //echo "print_r regnos"; //print_r($regnos); $modbus->deviceClose(); ?> deviceInit('/dev/ttyGW',9600,'none',8,2,'none'); // Open port $modbus->deviceOpen(); // Enable debug $modbus->debug = $debug; # read registers 0-224 in groups of 15 $regnos = array(); #Register Numbers 0-224 #0 to 16 $startingaddress = str_pad(dechex(90), 4, "0", STR_PAD_LEFT); //echo "\n$startingaddress\t"; $Numberofpoints = str_pad(dechex(30), 4, "0", STR_PAD_LEFT); //echo "\n$Numberofpoints\n"; $result=$modbus->sendQuery(1,3,"$startingaddress", 30); if($debug) print_r($result); echo "\n"; $air = array('Standby','PV and Grid Combined Discharge','Discharge','Fault','Flash','PV charge','AC charge','Combine charge','Combine charge and Bypass','PV charge and Bypass','AC charge and Bypass','Bypass','PV charge and Discharge'); //for($i=0; $i < 13; $i++) { echo "$i $air[$i]\n"; }; for($i=0; $i < 60; $i+=2) { $j = $i+1; $register = str_pad($i+180,3," ", STR_PAD_LEFT); $register = $register/2; $hex = $result[$i].$result[$j]; $dec = hexdec($hex); $dectenth = $dec/10; if ($register<100) echo " ",$register," ", 'hex Word ', $hex; if ($register>99) echo $register," ", 'hex Word ', $hex; if ($register==90) echo "\tNomOpFreq= $dectenth"; if ($register==91) echo "\tNomOpPow= $dec"; if ($register==92) echo "\tBlank"; if ($register==93) echo "\tBlank"; if ($register==94) echo "\tuwBatCutOffVolt= $dectenth"; if ($register==95) echo "\tAC switch to Battery= $dectenth"; if ($register==96) echo "\tBypEnable"; if ($register==97) echo "\tPowSavingEn"; if ($register==98) echo "\tSPowBAlEn"; if ($register==99) echo "\tClrEnergyToday"; if ($register==100) echo "\tClrEnergyAll"; if ($register==101) echo "\tBurnInTestEn"; if ($register==102) echo "\tManualStartEn"; if ($register==103) echo "\tSciChkEn"; if ($register==104) echo "\tControl BLightEn"; if ($register==105) echo "\tParaMaxChgCurr"; if ($register==106) echo "\tLi Protocol Type"; if ($register==107) echo "\tAudioAlarmEn"; if ($register==108) echo "\tuwEqEn"; if ($register==109) echo "\tuwEqChgVolt= $dectenth"; if ($register==110) echo "\tuwEqTime= $dectenth"; if ($register==111) echo "\tuwEqTimeOut= $dectenth"; if ($register==112) echo "\tuqEqInterval= $dectenth"; if ($register==113) echo "\tuwMaxDisChgCurr= $dectenth"; if ($register>113) echo "\tUnknown"; echo chr(10); $regnos[] = $result[$i] . $result[$j]; } $modbus->deviceClose(); ?> deviceInit('/dev/ttyGW',9600,'none',8,2,'none'); //print_r($modbus); //sleep(9); // Open port $modbus->deviceOpen(); //print_r($modbus); //sleep(9); // Enable debug $modbus->debug = $debug; # read registers 0-162 $regnos = array(); #Register Numbers 0-162 $startingaddress = str_pad(dechex(72), 4, "0", STR_PAD_LEFT); echo "\n$startingaddress\n"; echo "starting address = $startingaddress \n"; $Numberofpoints = str_pad(dechex(15), 4, "0", STR_PAD_LEFT); echo "\n$Numberofpoints\n"; $result=$modbus->sendQuery(1,3,"$startingaddress", 15); if($debug) print_r($result); //print ("1,3,$startingaddress,15"); //print_r($result); //sleep(9); for($i=0; $i < 30; $i+=2) { $j = $i+1; echo $i/2+72, '
Word = ', $result[$i] . $result[$j], chr(10); $regnos[] = $result[$i] . $result[$j]; } //echo "print_r regnos"; //print_r($regnos); $modbus->deviceClose(); ?> deviceInit('/dev/ttyGW',9600,'none',8,2,'none'); //print_r($modbus); //sleep(9); // Open port $modbus->deviceOpen(); //print_r($modbus); //sleep(9); // Enable debug $modbus->debug = $debug; # read registers 0-162 $regnos = array(); #Register Numbers 0-162 $startingaddress = str_pad(dechex(80), 4, "0", STR_PAD_LEFT); echo "\n$startingaddress\n"; echo "starting address = $startingaddress \n"; $Numberofpoints = str_pad(dechex(15), 4, "0", STR_PAD_LEFT); echo "\n$Numberofpoints\n"; $result=$modbus->sendQuery(1,3,"$startingaddress", 15); if($debug) print_r($result); //print ("1,3,$startingaddress,15"); //print_r($result); //sleep(9); for($i=0; $i < 30; $i+=2) { $j = $i+1; echo $i/2+80, '
Word = ', $result[$i] . $result[$j], chr(10); $regnos[] = $result[$i] . $result[$j]; } //echo "print_r regnos"; //print_r($regnos); $modbus->deviceClose(); ?> deviceInit('/dev/ttyGW',9600,'none',8,2,'none'); //print_r($modbus); //sleep(9); // Open port $modbus->deviceOpen(); //print_r($modbus); //sleep(9); // Enable debug $modbus->debug = $debug; # read registers 0-162 $regnos = array(); #Register Numbers 0-162 $startingaddress = str_pad(dechex(88), 4, "0", STR_PAD_LEFT); echo "\n$startingaddress\n"; echo "starting address = $startingaddress \n"; $Numberofpoints = str_pad(dechex(15), 4, "0", STR_PAD_LEFT); echo "\n$Numberofpoints\n"; $result=$modbus->sendQuery(1,3,"$startingaddress", 15); if($debug) print_r($result); //print ("1,3,$startingaddress,15"); //print_r($result); //sleep(9); for($i=0; $i < 30; $i+=2) { $j = $i+1; echo $i/2+88, '
Word = ', $result[$i] . $result[$j], chr(10); $regnos[] = $result[$i] . $result[$j]; } //echo "print_r regnos"; //print_r($regnos); $modbus->deviceClose(); ?> deviceInit('/dev/ttyGW',9600,'none',8,2,'none'); //print_r($modbus); //sleep(9); // Open port $modbus->deviceOpen(); //print_r($modbus); //sleep(9); // Enable debug $modbus->debug = $debug; # read registers 0-162 $regnos = array(); #Register Numbers 0-162 $startingaddress = str_pad(dechex(96), 4, "0", STR_PAD_LEFT); echo "\n$startingaddress\n"; echo "starting address = $startingaddress \n"; $Numberofpoints = str_pad(dechex(16), 4, "0", STR_PAD_LEFT); echo "\n$Numberofpoints\n"; $result=$modbus->sendQuery(1,3,"$startingaddress", 16); if($debug) print_r($result); //print ("1,3,$startingaddress,15"); //print_r($result); //sleep(9); for($i=0; $i < 32; $i+=2) { $j = $i+1; echo $i/2+96, '
Word = ', $result[$i] . $result[$j], chr(10); $regnos[] = $result[$i] . $result[$j]; } //echo "print_r regnos"; //print_r($regnos); $modbus->deviceClose(); ?> deviceInit('/dev/ttyGW',9600,'none',8,2,'none'); //print_r($modbus); //sleep(9); // Open port $modbus->deviceOpen(); //print_r($modbus); //sleep(9); // Enable debug $modbus->debug = $debug; # read registers 0-162 $regnos = array(); #Register Numbers 0-162 $startingaddress = str_pad(dechex(104), 4, "0", STR_PAD_LEFT); echo "\n$startingaddress\n"; echo "starting address = $startingaddress \n"; $Numberofpoints = str_pad(dechex(16), 4, "0", STR_PAD_LEFT); echo "\n$Numberofpoints\n"; $result=$modbus->sendQuery(1,3,"$startingaddress", 16); if($debug) print_r($result); //print ("1,3,$startingaddress,15"); //print_r($result); //sleep(9); for($i=0; $i < 32; $i+=2) { $j = $i+1; echo $i/2+104, '
Word = ', $result[$i] . $result[$j], chr(10); $regnos[] = $result[$i] . $result[$j]; } //echo "print_r regnos"; //print_r($regnos); $modbus->deviceClose(); ?> deviceInit('/dev/ttyGW',38400,'none',8,2,'none'); //print_r($modbus); sleep(9); // Open port $modbus->deviceOpen(); //print_r($modbus); sleep(9); // Enable debug $modbus->debug = $debug; # read registers 0-162 $regnos = array(); #Register Numbers 0-162 $startingaddress = str_pad(dechex(0), 4, "0", STR_PAD_LEFT); echo "\n$startingaddress\n"; $Numberofpoints = str_pad(dechex(15), 4, "0", STR_PAD_LEFT); echo "\n$Numberofpoints\n"; //echo "\nNumberofpoints = $Numberofpoints\n"; $result=$modbus->sendQuery(01,03,22,3); //if($debug) print_r($result); //print ("1,3,$startingaddress,15"); echo "\nresult\n"; print_r($result); echo "\nend\n"; //sleep(9); $modbus->deviceClose(); ?> deviceInit('/dev/ttyUSB0',38400,'none',8,2,'none'); //print_r($modbus); sleep(9); // Open port $modbus->deviceOpen(); //print_r($modbus); sleep(9); // Enable debug $modbus->debug = $debug; # read registers 0-162 $regnos = array(); #Register Numbers 0-162 $startingaddress = str_pad(dechex(0), 4, "0", STR_PAD_LEFT); echo "\n$startingaddress\n"; $Numberofpoints = str_pad(dechex(15), 4, "0", STR_PAD_LEFT); echo "\n$Numberofpoints\n"; //echo "\nNumberofpoints = $Numberofpoints\n"; $result=$modbus->sendQuery(01,03,22,3); //if($debug) print_r($result); //print ("1,3,$startingaddress,15"); echo "\nresult\n"; print_r($result); echo "\nend\n"; //sleep(9); $modbus->deviceClose(); ?> deviceInit('/dev/ttyGW',9600,'none',8,2,'none'); // Open port $modbus->deviceOpen(); // Enable debug $modbus->debug = $debug; # read registers 0-224 in groups of 15 $regnos = array(); #Register Numbers 0-224 #0 to 16 $startingaddress = str_pad(dechex(150), 4, "0", STR_PAD_LEFT); //echo "\n$startingaddress\t"; $Numberofpoints = str_pad(dechex(30), 4, "0", STR_PAD_LEFT); //echo "\n$Numberofpoints\n"; $result=$modbus->sendQuery(1,3,"$startingaddress", 30); if($debug) print_r($result); echo "
Read Input Registers
";
echo "\n";
$air = array('Standby','PV and Grid Combined Discharge','Discharge','Fault','Flash','PV charge','AC charge','Combine charge','Combine charge and Bypass','PV charge and Bypass','AC charge and Bypass','Bypass','PV charge and Discharge');
//for($i=0; $i < 13; $i++) {  echo "$i $air[$i]\n"; };
for($i=0; $i < 60; $i+=2) {
    $j = $i+1;
    $register = str_pad($i+300,3," ", STR_PAD_LEFT);
    $register = $register/2;
    $hex = $result[$i].$result[$j];
    $dec = hexdec($hex);
    $dectenth = $dec/10;
    echo " ",$register," ", 'hex Word ', $hex;
    if ($register==90) echo "\tNomOpFreq $dectenth";
    if ($register==91) echo "\tNomOpPow $dec";
    if ($register==2) echo "\tCharge Source set 0:PV_first 1:PV&Uti 2:PV_Only";
#    if ($register==3) echo "\tPV1 Power high";
    if ($register==94) echo "\tuwBatCutOffVolt $dectenth";
    if ($register==95) echo "\tAC switch to Battery $dectenth";
#    if ($register==6) echo "\tPV2 N/A";
#    if ($register==7) echo "\tBuck1 current $dectenth Amperes";
    if ($register==8) echo "\tAC Input Mode VAC 0:APL_90-140 1:UPS_65-140 2:Generator";
    if ($register==9) echo "\tFirmware version High";
    if ($register==10) echo "\tFirmware version Mid";
    if ($register==11) echo "\tFirmware version Low";
    if ($register==12) echo "\tControl Firmware version High";
    if ($register==13) echo "\tControl Firmware version Mid";
    if ($register==14) echo "\tControl Firmware version Low";
    if ($register==15) echo "\tLCD Language";
    if ($register==16) echo "\tGridV_Adj";
    if ($register==77) echo "\tRate 3000 watts? $dectenth";
    if ($register==79) echo "\tRate 3000 va? $dectenth";
    if ($register==84) echo "\tNomGridVolt $dectenth";
    if ($register==85) echo "\tNomGridFreq $dectenth";
    if ($register==86) echo "\tNomBatVolt $dectenth";
    if ($register==87) echo "\tNomPvCurr $dectenth";
    if ($register==88) echo "\tNomAcChgCurr $dectenth";
    if ($register==89) echo "\tNomOpVolt $dectenth";
    echo chr(10);
    $regnos[] = $result[$i] . $result[$j];
}
echo "
\n";
$modbus->deviceClose();
?>
deviceInit('/dev/ttyGW',9600,'none',8,2,'none');
// Open port
$modbus->deviceOpen();
// Enable debug
$modbus->debug = $debug;
# read registers 0-224 in groups of 15
$regnos = array(); #Register Numbers 0-224
#0 to 16
$startingaddress = str_pad(dechex(0), 4, "0", STR_PAD_LEFT);
//echo "\n$startingaddress\t";
$Numberofpoints = str_pad(dechex(15), 4, "0", STR_PAD_LEFT);
//echo "\n$Numberofpoints\n";
$result=$modbus->sendQuery(1,4,"$startingaddress", 16);
if($debug) print_r($result);
#echo "Read Input Registers
";
echo "\n";
$air = array('Standby','PV and Grid Combined Discharge','Discharge','Fault','Flash','PV charge','AC charge','Combine charge','Combine charge and Bypass','PV charge and Bypass','AC charge and Bypass','Bypass','PV charge and Discharge');
//for($i=0; $i < 13; $i++) {  echo "$i $air[$i]\n"; };
for($i=0; $i < 32; $i+=2) {
    $j = $i+1;
    $register = str_pad($i,3," ", STR_PAD_LEFT);
    $register = $register/2;
    $hex = $result[$i].$result[$j];
    $dec = hexdec($hex);
    $dectenth = $dec/10;
    echo $register," ", 'hex Word ', $hex," decimal ", hexdec($hex);
    if ($register==0) echo "\tSystem Status = $hex $air[$dec]";
    if ($register==1) echo "\tPV1 = $dectenth volts";
    if ($register==2) echo "\tPV2 Not available";
#    if ($register==3) echo "\tPV1 Power high";
    if ($register==4) echo "\tPV1 Power $dectenth watts";
#    if ($register==5) echo "\tPV1 x6553.6";
#    if ($register==6) echo "\tPV2 N/A";
    if ($register==7) echo "\tBuck1 current $dectenth Amperes";
#    if ($register==8) echo "\tBuck2 current N/A";
#    if ($register==9) echo "\tOutput power x 6553.6 watts";
    if ($register==10) echo "\tOutput power = ", (hexdec($hex)*0.1)," watts";
#    if ($register==11) echo "\tOutput va x 6553.6 ";
    if ($register==12) echo "\tOutput power va ", (hexdec($hex)*0.1),"";
#    if ($register==13) echo "\tAC Charge watts x 6553.6";
    if ($register==14) echo "\tAC charge power = ", (hexdec($hex)*0.1)," watts";
#    if ($register==15) echo "\tOutput va x 6553.6";
    if ($register==16) echo "\tAC charge power = ", (hexdec($hex)*0.1)," va";
    echo chr(10);
    $regnos[] = $result[$i] . $result[$j];
}
#echo "
\n";
$modbus->deviceClose();
?>
deviceInit('/dev/ttyGW',9600,'none',8,2,'none');
// Open port
$modbus->deviceOpen();
// Enable debug
$modbus->debug = $debug;
# read registers 0-224 in groups of 15
$regnos = array(); #Register Numbers 0-224
#0 to 14
$startingaddress = str_pad(dechex(0), 4, "0", STR_PAD_LEFT); echo "\n$startingaddress\t";
$Numberofpoints = str_pad(dechex(15), 4, "0", STR_PAD_LEFT); echo "\n$Numberofpoints\n";
$result=$modbus->sendQuery(1,4,"$startingaddress", 16);
if($debug) print_r($result);
for($i=0; $i < 32; $i+=2) {
$j = $i+1;
$register = str_pad($i,3," ", STR_PAD_LEFT);
$register = $register/2;
$hex = $result[$i].$result[$j];
echo $register," ", 'hex Word ', $hex," decimal ", hexdec($hex), chr(10);
$regnos[] = $result[$i] . $result[$j];
}
$modbus->deviceClose();
?>
deviceInit('/dev/ttyGW',9600,'none',8,2,'none');
// Open port
$modbus->deviceOpen();
// Enable debug
$modbus->debug = $debug;
# read registers 0-224 in groups of 15
$regnos = array(); #Register Numbers 0-224
#0 to 14
$startingaddress = str_pad(dechex(16), 4, "0", STR_PAD_LEFT);
//echo "\n$startingaddress\t";
$Numberofpoints = str_pad(dechex(16), 4, "0", STR_PAD_LEFT);
//echo "\n$Numberofpoints\n";
$result=$modbus->sendQuery(1,4,"$startingaddress", 16);
if($debug) print_r($result);
#echo "Read Input Registers
\n";
for($i=0; $i < 32; $i+=2) {
    $j = $i+1;
    $register = $i/2;
    $register = str_pad($register+16,3," ", STR_PAD_LEFT);
    $hex = $result[$i].$result[$j];
    $hexout = hexdec($hex);
    $hex7e = $hexout & 0x7c;
    $lineout = "hex $register\tword ".$hex."\tdecimal ".$hexout; echo $lineout;
    //echo " hex Word  $hex \tdecimal ", hexdec($hex);
    if ($register==16) echo "\tAC charge power = ", (hexdec($hex)*0.1)," va";
    if ($register==17) {
      $lbv = file_get_contents("lbv.txt");
      echo "\tBattery voltage ",hexdec($hex)*0.01, " was ",$lbv;
      $lbv = ($hexout)/100;
      $lbv = trim($lbv,  " \n\r\t\v\x00");
      file_put_contents("lbv.txt",$lbv);
      }
    if ($register==18) echo "\tBattery SOC ",hexdec($hex),"% (0, 25, 50, 75, 100)";
    if ($register==19) echo "\tBuss voltage ",hexdec($hex)*0.1;
    if ($register==20) echo "\tGrid voltage ",hexdec($hex)*0.1;
    if ($register==21) echo "\tLine frequency Hz ",hexdec($hex)*0.01;
    if ($register==22) echo "\tOutput voltage ",hexdec($hex)*0.1;
    if ($register==23) echo "\tAC output frequency Hz ",hexdec($hex)*0.01;
    if ($register==24) echo "\tOutput DC volt ",hexdec($hex)*0.1;
    if ($register==25) echo "\tInverter temperature ",hexdec($hex)*0.1,"C ",(hexdec($hex)*0.1)*9/5+32,"F $hex7e";
    if ($register==26) echo "\tDC-DC temperature ",hexdec($hex)*0.1,"C ",(hexdec($hex)*0.1)*9/5+32,"F $hex7e";
    if ($register==27) echo "\tAC output load ",hexdec($hex)*0.1, "%";
    if ($register==30) echo "\tAC input ",hexdec($hex)*0.1, " Watts";
    echo chr(10);
    $regnos[] = $result[$i] . $result[$j];
}
#echo "
\n";
$modbus->deviceClose();
?>
deviceInit('/dev/ttyGW',9600,'none',8,2,'none');
// Open port
$modbus->deviceOpen();
// Enable debug
$modbus->debug = $debug;
# read registers 0-224 in groups of 15
$regnos = array(); #Register Numbers 0-224
#0 to 14
$startingaddress = str_pad(dechex(32), 4, "0", STR_PAD_LEFT); echo "\n$startingaddress\t";
$Numberofpoints = str_pad(dechex(16), 4, "0", STR_PAD_LEFT); echo "\n$Numberofpoints\n";
$result=$modbus->sendQuery(1,4,"$startingaddress", 16);
if($debug) print_r($result);
for($i=0; $i < 32; $i+=2) {
$j = $i+1;
$register = $i/2;
$register = str_pad($register+32,3," ", STR_PAD_LEFT);
$hex = $result[$i].$result[$j];
echo $register," ", 'hex Word ', $hex," decimal ", hexdec($hex), chr(10);
$regnos[] = $result[$i] . $result[$j];
}
$modbus->deviceClose();
?>
deviceInit('/dev/ttyGW',9600,'none',8,2,'none');
// Open port
$modbus->deviceOpen();
// Enable debug
$modbus->debug = $debug;
# read registers 0-224 in groups of 15
$regnos = array(); #Register Numbers 0-224
#0 to 15
$startingaddress = str_pad(dechex(32), 4, "0", STR_PAD_LEFT);
echo "\n$startingaddress\n";
$Numberofpoints = str_pad(dechex(16), 4, "0", STR_PAD_LEFT);
//echo "\n$Numberofpoints\n";
$result=$modbus->sendQuery(1,4,"$startingaddress", 16);
if($debug) print_r($result);
#echo "Read Input Registers
\n";
for($i=0; $i < 32; $i+=2) {
    $j = $i+1;
    $register = $i/2;
    $register = str_pad($register+32,3," ", STR_PAD_LEFT);
    $hex = $result[$i].$result[$j];
    $hexout = hexdec($hex);
    $hex7e = $hexout & 0x7c;
    $lineout = "hex $register\tword ".$hex."\tdecimal ".$hexout; echo $lineout;
    //echo " hex Word  $hex \tdecimal ", hexdec($hex);
    if ($register==16) echo "\tAC charge power = ", (hexdec($hex)*0.1)," va";
    if ($register==17) {
      $lbv = file_get_contents("lbv.txt");
      echo "\tBattery voltage ",hexdec($hex)*0.01, " was ",$lbv;
      $lbv = ($hexout)/100;
      $lbv = trim($lbv,  " \n\r\t\v\x00");
      file_put_contents("lbv.txt",$lbv);
      }
    if ($register==18) echo "\tBattery SOC ",hexdec($hex),"% (0, 25, 50, 75, 100)";
    if ($register==19) echo "\tBuss voltage ",hexdec($hex)*0.1;
    if ($register==20) echo "\tGrid voltage ",hexdec($hex)*0.1;
    if ($register==21) echo "\tLine frequency Hz ",hexdec($hex)*0.01;
    if ($register==22) echo "\tOutput voltage ",hexdec($hex)*0.1;
    if ($register==23) echo "\tAC output frequency Hz ",hexdec($hex)*0.01;
    if ($register==24) echo "\tOutput DC volt ",hexdec($hex)*0.1;
    if ($register==25) echo "\tInverter temperature ",hexdec($hex)*0.1,"C ",(hexdec($hex)*0.1)*9/5+32,"F $hex7e";
    if ($register==26) echo "\tDC-DC temperature ",hexdec($hex)*0.1,"C ",(hexdec($hex)*0.1)*9/5+32,"F $hex7e";
    if ($register==27) echo "\tAC output load ",hexdec($hex)*0.1, "%";
    if ($register==30) echo "\tAC input ",hexdec($hex)*0.1, " Watts";
    echo chr(10);
    $regnos[] = $result[$i] . $result[$j];
}
#echo "
\n";
$modbus->deviceClose();
?>
deviceInit('/dev/ttyGW',9600,'none',8,2,'none');
// Open port
$modbus->deviceOpen();
// Enable debug
$modbus->debug = $debug;
# read registers 0-224 in groups of 15
$regnos = array(); #Register Numbers 0-224
#0 to 15
$startingaddress = str_pad(dechex(48), 4, "0", STR_PAD_LEFT);
//echo "\n$startingaddress\n";
$Numberofpoints = str_pad(dechex(16), 4, "0", STR_PAD_LEFT);
//echo "\n$Numberofpoints\n";
$result=$modbus->sendQuery(1,4,"$startingaddress", 16);
if($debug) print_r($result);
#echo "Read Input Registers
\n";
for($i=0; $i < 32; $i+=2) {
    $j = $i+1;
    $register = $i/2;
    $register = str_pad($register+48,3," ", STR_PAD_LEFT);
    $hex = $result[$i].$result[$j];
    $hexout = hexdec($hex);
    $hex7e = $hexout & 0x7c;
    $lineout = "hex $register\tword ".$hex."\tdecimal ".$hexout; echo $lineout;
    //echo " hex Word  $hex \tdecimal ", hexdec($hex);
    if ($register==16) echo "\tAC charge power = ", (hexdec($hex)*0.1)," va";
    if ($register==17) {
      $lbv = file_get_contents("lbv.txt");
      echo "\tBattery voltage ",hexdec($hex)*0.01, " was ",$lbv;
      $lbv = ($hexout)/100;
      $lbv = trim($lbv,  " \n\r\t\v\x00");
      file_put_contents("lbv.txt",$lbv);
      }
    if ($register==18) echo "\tBattery SOC ",hexdec($hex),"% (0, 25, 50, 75, 100)";
    if ($register==19) echo "\tBuss voltage ",hexdec($hex)*0.1;
    if ($register==20) echo "\tGrid voltage ",hexdec($hex)*0.1;
    if ($register==21) echo "\tLine frequency Hz ",hexdec($hex)*0.01;
    if ($register==22) echo "\tOutput voltage ",hexdec($hex)*0.1;
    if ($register==23) echo "\tAC output frequency Hz ",hexdec($hex)*0.01;
    if ($register==24) echo "\tOutput DC volt ",hexdec($hex)*0.1;
    if ($register==25) echo "\tInverter temperature ",hexdec($hex)*0.1,"C ",(hexdec($hex)*0.1)*9/5+32,"F $hex7e";
    if ($register==26) echo "\tDC-DC temperature ",hexdec($hex)*0.1,"C ",(hexdec($hex)*0.1)*9/5+32,"F $hex7e";
    if ($register==27) echo "\tAC output load ",hexdec($hex)*0.1, "%";
    if ($register==30) echo "\tAC input ",hexdec($hex)*0.1, " Watts";
    echo chr(10);
    $regnos[] = $result[$i] . $result[$j];
}
#echo "
\n";
$modbus->deviceClose();
?>
deviceInit('/dev/ttyGW',9600,'none',8,2,'none');
// Open port
$modbus->deviceOpen();
// Enable debug
$modbus->debug = $debug;
# read registers 0-224 in groups of 15
$regnos = array(); #Register Numbers 0-224
#0 to 15
$startingaddress = str_pad(dechex(64), 4, "0", STR_PAD_LEFT);
//echo "\n$startingaddress\n";
$Numberofpoints = str_pad(dechex(16), 4, "0", STR_PAD_LEFT);
//echo "\n$Numberofpoints\n";
$result=$modbus->sendQuery(1,4,"$startingaddress", 16);
if($debug) print_r($result);
#echo "Read Input Registers
\n";
for($i=0; $i < 32; $i+=2) {
    $j = $i+1;
    $register = $i/2;
    $register = str_pad($register+64,3," ", STR_PAD_LEFT);
    $hex = $result[$i].$result[$j];
    $hexout = hexdec($hex);
    $hex7e = $hexout & 0x7c;
    $lineout = "hex $register\tword ".$hex."\tdecimal ".$hexout; echo $lineout;
    //echo " hex Word  $hex \tdecimal ", hexdec($hex);
    if ($register==16) echo "\tAC charge power = ", (hexdec($hex)*0.1)," va";
    if ($register==17) {
      $lbv = file_get_contents("lbv.txt");
      echo "\tBattery voltage ",hexdec($hex)*0.01, " was ",$lbv;
      $lbv = ($hexout)/100;
      $lbv = trim($lbv,  " \n\r\t\v\x00");
      file_put_contents("lbv.txt",$lbv);
      }
    if ($register==18) echo "\tBattery SOC ",hexdec($hex),"% (0, 25, 50, 75, 100)";
    if ($register==19) echo "\tBuss voltage ",hexdec($hex)*0.1;
    if ($register==20) echo "\tGrid voltage ",hexdec($hex)*0.1;
    if ($register==21) echo "\tLine frequency Hz ",hexdec($hex)*0.01;
    if ($register==22) echo "\tOutput voltage ",hexdec($hex)*0.1;
    if ($register==23) echo "\tAC output frequency Hz ",hexdec($hex)*0.01;
    if ($register==24) echo "\tOutput DC volt ",hexdec($hex)*0.1;
    if ($register==25) echo "\tInverter temperature ",hexdec($hex)*0.1,"C ",(hexdec($hex)*0.1)*9/5+32,"F $hex7e";
    if ($register==26) echo "\tDC-DC temperature ",hexdec($hex)*0.1,"C ",(hexdec($hex)*0.1)*9/5+32,"F $hex7e";
    if ($register==27) echo "\tAC output load ",hexdec($hex)*0.1, "%";
    if ($register==30) echo "\tAC input ",hexdec($hex)*0.1, " Watts";
    echo chr(10);
    $regnos[] = $result[$i] . $result[$j];
}
#echo "
\n";
$modbus->deviceClose();
?>
deviceInit('/dev/ttyGW',9600,'none',8,2,'none');
// Open port
$modbus->deviceOpen();
// Enable debug
$modbus->debug = $debug;
# read registers 0-224 in groups of 15
$regnos = array(); #Register Numbers 0-224
#0 to 14
$startingaddress = str_pad(dechex(80), 4, "0", STR_PAD_LEFT);
//echo "\n$startingaddress\t";
$Numberofpoints = str_pad(dechex(16), 4, "0", STR_PAD_LEFT);
//echo "\n$Numberofpoints\n";
$result=$modbus->sendQuery(1,4,"$startingaddress", 16);
if($debug) print_r($result);
echo "\nRead Input Registers
";
for($i=0; $i < 32; $i+=2) {
    $j = $i+1;
    $register = $i/2;
    $register = str_pad($register+80,3," ", STR_PAD_LEFT);
    $hex = $result[$i].$result[$j];
    echo $register," ", 'hex Word ', $hex," decimal ", hexdec($hex);
    if ($register==82) echo "\tInverter fan speed ",hexdec($hex)*0.01,"%";
    if ($register==83) echo "\tCharge current ",hexdec($hex)," Amperes";
    echo chr(10);
    $regnos[] = $result[$i] . $result[$j];
}
echo "
\n";
$modbus->deviceClose();
?>
deviceInit('/dev/ttyGW',9600,'none',8,2,'none');
// Open port
$modbus->deviceOpen();
// Enable debug
$modbus->debug = $debug;
# read registers 0-224 in groups of 15
$regnos = array(); #Register Numbers 0-224
#0 to 14
$startingaddress = str_pad(dechex(0), 4, "0", STR_PAD_LEFT); echo "\n$startingaddress\t";
$Numberofpoints = str_pad(dechex(15), 4, "0", STR_PAD_LEFT); echo "\n$Numberofpoints\n";
$result=$modbus->sendQuery(1,4,"$startingaddress", 16);
if($debug) print_r($result);
for($i=0; $i < 32; $i+=2) {
$j = $i+1;
$register = str_pad($i,3," ", STR_PAD_LEFT);
$register = $register/2;
$hex = $result[$i].$result[$j];
echo $register," ", 'hex Word ', $hex," decimal ", hexdec($hex), chr(10);
$regnos[] = $result[$i] . $result[$j];
}
$modbus->deviceClose();
?>
query($sql)->fetchArray(SQLITE3_NUM);
if($debug) echo "\n $serial, $dtasof";
$title = " GW Battery 193 Hours $dtasof ";
# Data for plot #1:
$y_title1 = 'SOC%';
$data1 = array();
#$sql = "select case when strftime('%M', dt) = '00' then strftime('%H', dt) else '' end , BatSOC, -Bat_Watt from period25hrs order by dt" ;
$sql = "select case when strftime('%M', dt) = '00' then strftime('%H', dt) else '.' end , BatSOC from period193hrs order by dt" ;
#@# where dt >= (select datetime(max(dt), '-25 hour') from period25hrs) order by dt" ;
#@# where date(dt) = (select date(max(dt)) from period25hrs) order by dt";
if($debug) echo "\n$sql";
$qr = $db->query($sql);
while($row = $qr->fetchArray(SQLITE3_NUM)) {
$data1[] = $row;
if($debug) echo'.';
}
if($debug) print_r($data1);
$legend1 = array('SOC%');
# Data for plot #2:
$y_title2 = 'Volts';
$data2 = array();
#$sql = "select NULL, BatVolt, 8*3.375, 25.6 from period193hrs order by dt" ; #Balance, AGM Low Float, AGM 50%
$sql = "select NULL, BatVolt, 8*3.45, 25.6 from period193hrs order by dt" ; #Balance, LiFePO4 100% SOC, SOC 10% 20221202
if($debug) echo "\n$sql";
$qr = $db->query($sql);
while($row = $qr->fetchArray(SQLITE3_NUM)) {
$data2[] = $row;
if($debug) echo'.';
}
if($debug) print_r($data2);
#$legend2 = array('Bat', 'BMS Bal', 'Low Bat');
$legend2 = array('Bat', 'Charge target', 'SOC 10%');
# battery cell voltage range
# list($bulknbr) = $db->query( "select count(*) from period193hrs where charge_state = 5 and dt > datetime('now','localtime','-1 days')" )->fetchArray(SQLITE3_NUM);
#$sql = "select min(25.6, min(BatVolt))-0.1, max(28.2, max(BatVolt))+0.1 from period193hrs order by dt" ;
$sql = "select min(25.6, min(BatVolt))-0.1, max(28.0, max(BatVolt))+0.1 from period193hrs order by dt" ; #20221202
if($debug) echo "\n$sql";
list($lv, $uv) = $db->query($sql)->fetchArray(SQLITE3_NUM);
#
$plot = new PHPlot(1280, 620);
$plot->SetImageBorderType('plain'); // For presentation in the manual
$plot->SetPrintImage(False); // Defer output until the end
$plot->SetTitle($title);
$plot->SetLightGridColor('black'); // So grid stands out from background
# Plot 1
# Set margins to leave room for plot 2 Y title on the right.
$plot->SetMarginsPixels(56, 56);
#$plot->SetPlotBgColor('gray');
$plot->SetDrawPlotAreaBackground(True);
$plot->SetPlotType('linepoints');
$plot->SetDataType('text-data');
$plot->SetDataValues($data1);
$plot->SetYTitle($y_title1);
# Set and position legend #1:
$plot->SetLegendUseShapes(true); #false = boxes or true = shapes ####<===== add this line
$plot->SetLegend($legend1);
$plot->SetLegendPixels(58, 27);
# Colors are significant to this data:
$plot->SetDataColors(array('navy', 'maroon'));
# Specify Y range of these data sets:
$plot->SetPlotAreaWorld(NULL, NULL, NULL, NULL);
#$plot->SetYTickIncrement(500);
$plot->SetXTitle('Hours');
$plot->SetXTickLabelPos('none');
$plot->SetXTickPos('none');
# Format Y tick labels as integers, with thousands separator:
#$plot->SetYLabelType('data', 0);
$plot->SetPointSizes(array('5','9'));
$plot->SetLineWidths(array('1','9'));
$plot->SetPointShapes(array('circle','cross'));
$plot->SetPlotType('squared');
$plot->DrawGraph();
# Plot 2
$plot->SetDrawPlotAreaBackground(False); // Cancel background
$plot->SetDrawYGrid(False); // Cancel grid, already drawn
$plot->SetPlotType('linepoints');
$plot->SetDataValues($data2);
# Set Y title for plot #2 and position it on the right side:
$plot->SetYTitle($y_title2, 'plotright');
# Set and position legend #2:
$plot->SetLegend($legend2);
$plot->SetLegendPixels(400, 25);
# Colors are significant to this data:
$plot->SetDataColors(array('navy'));
# Specify Y range of this data set:
$plot->SetPlotAreaWorld(NULL, $lv, NULL, $uv);
$plot->SetYTickIncrement(.2);
$plot->SetYTickPos('plotright');
$plot->SetYTickLabelPos('plotright');
$plot->SetDataColors(array('black', 'gold', 'orchid'));
# Format Y tick labels as integers with trailing percent sign:
$plot->SetYLabelType('data', 2);
$plot->SetYTickAnchor(3.2);
$plot->SetPointSizes(array('4','4','4','3'));
$plot->SetLineWidths(array('1','1','1','4'));
$plot->SetPointShapes(array('plus','circle','circle'));
$plot->DrawGraph();
# Now output the graph with both plots:
if(!$debug) $plot->PrintImage();
################################################################################################################################################
query($sql)->fetchArray(SQLITE3_NUM);
if($debug) echo "\n $serial, $dtasof";
$title = " GW Battery 25 Hours $dtasof ";
# Data for plot #1:
$y_title1 = 'SOC%';
$data1 = array();
#$sql = "select case when strftime('%M', dt) = '00' then strftime('%H', dt) else '' end , BatSOC, -Bat_Watt from period25hrs order by dt" ;
$sql = "select case when strftime('%M', dt) = '00' then strftime('%H', dt) else '.' end , BatSOC from period25hrs order by dt" ;
#@# where dt >= (select datetime(max(dt), '-25 hour') from period25hrs) order by dt" ;
#@# where date(dt) = (select date(max(dt)) from period25hrs) order by dt";
if($debug) echo "\n$sql";
$qr = $db->query($sql);
while($row = $qr->fetchArray(SQLITE3_NUM)) {
$data1[] = $row;
if($debug) echo'.';
}
if($debug) print_r($data1);
$legend1 = array('SOC%');
# Data for plot #2:
$y_title2 = 'Volts';
$data2 = array();
#$sql = "select NULL, BatVolt, 8*3.375, 25.6 from period25hrs order by dt" ; #Balance, AGM Low Float, AGM 50%
$sql = "select NULL, BatVolt, 8*3.45, 25.6 from period25hrs order by dt" ; #Balance, LiFePO4 100% SOC, SOC 10% 20221202
if($debug) echo "\n$sql";
$qr = $db->query($sql);
while($row = $qr->fetchArray(SQLITE3_NUM)) {
$data2[] = $row;
if($debug) echo'.';
}
if($debug) print_r($data2);
#$legend2 = array('Bat', 'BMS Bal', 'Low Bat');
$legend2 = array('Bat', 'Charge target', 'SOC 10%');
# battery cell voltage range
# list($bulknbr) = $db->query( "select count(*) from period25hrs where charge_state = 5 and dt > datetime('now','localtime','-1 days')" )->fetchArray(SQLITE3_NUM);
#$sql = "select min(25.6, min(BatVolt))-0.1, max(28.2, max(BatVolt))+0.1 from period25hrs order by dt" ;
$sql = "select min(25.6, min(BatVolt))-0.1, max(28.0, max(BatVolt))+0.1 from period25hrs order by dt" ; #20221202
if($debug) echo "\n$sql";
list($lv, $uv) = $db->query($sql)->fetchArray(SQLITE3_NUM);
#
$plot = new PHPlot(1280, 620);
$plot->SetImageBorderType('plain'); // For presentation in the manual
$plot->SetPrintImage(False); // Defer output until the end
$plot->SetTitle($title);
$plot->SetLightGridColor('black'); // So grid stands out from background
# Plot 1
# Set margins to leave room for plot 2 Y title on the right.
$plot->SetMarginsPixels(56, 56);
#$plot->SetPlotBgColor('gray');
$plot->SetDrawPlotAreaBackground(True);
$plot->SetPlotType('linepoints');
$plot->SetDataType('text-data');
$plot->SetDataValues($data1);
$plot->SetYTitle($y_title1);
# Set and position legend #1:
$plot->SetLegendUseShapes(true); #false = boxes or true = shapes ####<===== add this line
$plot->SetLegend($legend1);
$plot->SetLegendPixels(58, 27);
# Colors are significant to this data:
$plot->SetDataColors(array('navy', 'maroon'));
# Specify Y range of these data sets:
$plot->SetPlotAreaWorld(NULL, NULL, NULL, NULL);
#$plot->SetYTickIncrement(500);
$plot->SetXTitle('Hours');
$plot->SetXTickLabelPos('none');
$plot->SetXTickPos('none');
# Format Y tick labels as integers, with thousands separator:
#$plot->SetYLabelType('data', 0);
$plot->SetPointSizes('5','9');
$plot->SetLineWidths('1','9');
$plot->SetPointShapes('circle','cross');
$plot->SetPlotType('squared');
$plot->DrawGraph();
# Plot 2
$plot->SetDrawPlotAreaBackground(False); // Cancel background
$plot->SetDrawYGrid(False); // Cancel grid, already drawn
$plot->SetPlotType('linepoints');
$plot->SetDataValues($data2);
# Set Y title for plot #2 and position it on the right side:
$plot->SetYTitle($y_title2, 'plotright');
# Set and position legend #2:
$plot->SetLegend($legend2);
$plot->SetLegendPixels(400, 25);
# Colors are significant to this data:
$plot->SetDataColors(array('navy'));
# Specify Y range of this data set:
$plot->SetPlotAreaWorld(NULL, $lv, NULL, $uv);
$plot->SetYTickIncrement(.2);
$plot->SetYTickPos('plotright');
$plot->SetYTickLabelPos('plotright');
$plot->SetDataColors(array('black', 'gold', 'orchid'));
# Format Y tick labels as integers with trailing percent sign:
$plot->SetYLabelType('data', 2);
$plot->SetYTickAnchor(3.2);
$plot->SetPointSizes('5','5','5','5');
$plot->SetLineWidths('1','1','1','4');
$plot->SetPointShapes('dot','cross','line');
$plot->DrawGraph();
# Now output the graph with both plots:
if(!$debug) $plot->PrintImage();
################################################################################################################################################
query($sql)->fetchArray(SQLITE3_NUM);
if($debug) echo "\n $serial, $dtasof";
$title = " GW Battery 49 Hours $dtasof ";
# Data for plot #1:
$y_title1 = 'SOC%';
$data1 = array();
#$sql = "select case when strftime('%M', dt) = '00' then strftime('%H', dt) else '' end , BatSOC, -Bat_Watt from period25hrs order by dt" ;
$sql = "select case when strftime('%M', dt) = '00' then strftime('%H', dt) else '.' end , BatSOC from period49hrs order by dt" ;
#@# where dt >= (select datetime(max(dt), '-25 hour') from period25hrs) order by dt" ;
#@# where date(dt) = (select date(max(dt)) from period25hrs) order by dt";
if($debug) echo "\n$sql";
$qr = $db->query($sql);
while($row = $qr->fetchArray(SQLITE3_NUM)) {
$data1[] = $row;
if($debug) echo'.';
}
if($debug) print_r($data1);
$legend1 = array('SOC%');
# Data for plot #2:
$y_title2 = 'Volts';
$data2 = array();
#$sql = "select NULL, BatVolt, 8*3.375, 25.6 from period49hrs order by dt" ; #Balance, AGM Low Float, AGM 50%
$sql = "select NULL, BatVolt, 8*3.45, 25.6 from period49hrs order by dt" ; #Balance, LiFePO4 100% SOC, SOC 10% 20221202
if($debug) echo "\n$sql";
$qr = $db->query($sql);
while($row = $qr->fetchArray(SQLITE3_NUM)) {
$data2[] = $row;
if($debug) echo'.';
}
if($debug) print_r($data2);
#$legend2 = array('Bat', 'BMS Bal', 'Low Bat');
$legend2 = array('Bat', 'Charge target', 'SOC 10%');
# battery cell voltage range
# list($bulknbr) = $db->query( "select count(*) from period49hrs where charge_state = 5 and dt > datetime('now','localtime','-1 days')" )->fetchArray(SQLITE3_NUM);
#$sql = "select min(25.6, min(BatVolt))-0.1, max(28.2, max(BatVolt))+0.1 from period49hrs order by dt" ;
$sql = "select min(25.6, min(BatVolt))-0.1, max(28.0, max(BatVolt))+0.1 from period49hrs order by dt" ; #20221202
if($debug) echo "\n$sql";
list($lv, $uv) = $db->query($sql)->fetchArray(SQLITE3_NUM);
#
$plot = new PHPlot(1280, 620);
$plot->SetImageBorderType('plain'); // For presentation in the manual
$plot->SetPrintImage(False); // Defer output until the end
$plot->SetTitle($title);
$plot->SetLightGridColor('black'); // So grid stands out from background
# Plot 1
# Set margins to leave room for plot 2 Y title on the right.
$plot->SetMarginsPixels(56, 56);
#$plot->SetPlotBgColor('gray');
$plot->SetDrawPlotAreaBackground(True);
$plot->SetPlotType('linepoints');
$plot->SetDataType('text-data');
$plot->SetDataValues($data1);
$plot->SetYTitle($y_title1);
# Set and position legend #1:
$plot->SetLegendUseShapes(true); #false = boxes or true = shapes ####<===== add this line
$plot->SetLegend($legend1);
$plot->SetLegendPixels(58, 27);
# Colors are significant to this data:
$plot->SetDataColors(array('navy', 'maroon'));
# Specify Y range of these data sets:
$plot->SetPlotAreaWorld(NULL, NULL, NULL, NULL);
#$plot->SetYTickIncrement(500);
$plot->SetXTitle('Hours');
$plot->SetXTickLabelPos('none');
$plot->SetXTickPos('none');
# Format Y tick labels as integers, with thousands separator:
#$plot->SetYLabelType('data', 0);
$plot->SetPointSizes('5','9');
$plot->SetLineWidths('1','9');
$plot->SetPointShapes('circle','cross');
$plot->SetPlotType('squared');
$plot->DrawGraph();
# Plot 2
$plot->SetDrawPlotAreaBackground(False); // Cancel background
$plot->SetDrawYGrid(False); // Cancel grid, already drawn
$plot->SetPlotType('linepoints');
$plot->SetDataValues($data2);
# Set Y title for plot #2 and position it on the right side:
$plot->SetYTitle($y_title2, 'plotright');
# Set and position legend #2:
$plot->SetLegend($legend2);
$plot->SetLegendPixels(400, 25);
# Colors are significant to this data:
$plot->SetDataColors(array('navy'));
# Specify Y range of this data set:
$plot->SetPlotAreaWorld(NULL, $lv, NULL, $uv);
$plot->SetYTickIncrement(.2);
$plot->SetYTickPos('plotright');
$plot->SetYTickLabelPos('plotright');
$plot->SetDataColors(array('black', 'gold', 'orchid'));
# Format Y tick labels as integers with trailing percent sign:
$plot->SetYLabelType('data', 2);
$plot->SetYTickAnchor(3.2);
$plot->SetPointSizes('5','5','5','5');
$plot->SetLineWidths('1','1','1','4');
$plot->SetPointShapes('dot','cross','line');
$plot->DrawGraph();
# Now output the graph with both plots:
if(!$debug) $plot->PrintImage();
################################################################################################################################################
query($sql)->fetchArray(SQLITE3_NUM);
if($debug) echo "\n $serial, $dtasof";
$title = " GW Battery 97 Hours $dtasof ";
# Data for plot #1:
$y_title1 = 'SOC%';
$data1 = array();
#$sql = "select case when strftime('%M', dt) = '00' then strftime('%H', dt) else '' end , BatSOC, -Bat_Watt from period25hrs order by dt" ;
$sql = "select case when strftime('%M', dt) = '00' then strftime('%H', dt) else '.' end , BatSOC from period97hrs order by dt" ;
#@# where dt >= (select datetime(max(dt), '-25 hour') from period25hrs) order by dt" ;
#@# where date(dt) = (select date(max(dt)) from period25hrs) order by dt";
if($debug) echo "\n$sql";
$qr = $db->query($sql);
while($row = $qr->fetchArray(SQLITE3_NUM)) {
$data1[] = $row;
if($debug) echo'.';
}
if($debug) print_r($data1);
$legend1 = array('SOC%');
# Data for plot #2:
$y_title2 = 'Volts';
$data2 = array();
#$sql = "select NULL, BatVolt, 8*3.375, 25.6 from period97hrs order by dt" ; #Balance, AGM Low Float, AGM 50%
$sql = "select NULL, BatVolt, 8*3.45, 25.6 from period97hrs order by dt" ; #Balance, LiFePO4 100% SOC, SOC 10% 20221202
if($debug) echo "\n$sql";
$qr = $db->query($sql);
while($row = $qr->fetchArray(SQLITE3_NUM)) {
$data2[] = $row;
if($debug) echo'.';
}
if($debug) print_r($data2);
#$legend2 = array('Bat', 'BMS Bal', 'Low Bat');
$legend2 = array('Bat', 'Charge target', 'SOC 10%');
# battery cell voltage range
# list($bulknbr) = $db->query( "select count(*) from period97hrs where charge_state = 5 and dt > datetime('now','localtime','-1 days')" )->fetchArray(SQLITE3_NUM);
#$sql = "select min(25.6, min(BatVolt))-0.1, max(28.2, max(BatVolt))+0.1 from period97hrs order by dt" ;
$sql = "select min(25.6, min(BatVolt))-0.1, max(28.0, max(BatVolt))+0.1 from period97hrs order by dt" ; #20221202
if($debug) echo "\n$sql";
list($lv, $uv) = $db->query($sql)->fetchArray(SQLITE3_NUM);
#
$plot = new PHPlot(1280, 620);
$plot->SetImageBorderType('plain'); // For presentation in the manual
$plot->SetPrintImage(False); // Defer output until the end
$plot->SetTitle($title);
$plot->SetLightGridColor('black'); // So grid stands out from background
# Plot 1
# Set margins to leave room for plot 2 Y title on the right.
$plot->SetMarginsPixels(56, 56);
#$plot->SetPlotBgColor('gray');
$plot->SetDrawPlotAreaBackground(True);
$plot->SetPlotType('linepoints');
$plot->SetDataType('text-data');
$plot->SetDataValues($data1);
$plot->SetYTitle($y_title1);
# Set and position legend #1:
$plot->SetLegendUseShapes(true); #false = boxes or true = shapes ####<===== add this line
$plot->SetLegend($legend1);
$plot->SetLegendPixels(58, 27);
# Colors are significant to this data:
$plot->SetDataColors(array('navy', 'maroon'));
# Specify Y range of these data sets:
$plot->SetPlotAreaWorld(NULL, NULL, NULL, NULL);
#$plot->SetYTickIncrement(500);
$plot->SetXTitle('Hours');
$plot->SetXTickLabelPos('none');
$plot->SetXTickPos('none');
# Format Y tick labels as integers, with thousands separator:
#$plot->SetYLabelType('data', 0);
$plot->SetPointSizes(array('5','9'));
$plot->SetLineWidths(array('1','9'));
$plot->SetPointShapes(array('circle','cross'));
$plot->SetPlotType('squared');
$plot->DrawGraph();
# Plot 2
$plot->SetDrawPlotAreaBackground(False); // Cancel background
$plot->SetDrawYGrid(False); // Cancel grid, already drawn
$plot->SetPlotType('linepoints');
$plot->SetDataValues($data2);
# Set Y title for plot #2 and position it on the right side:
$plot->SetYTitle($y_title2, 'plotright');
# Set and position legend #2:
$plot->SetLegend($legend2);
$plot->SetLegendPixels(400, 25);
# Colors are significant to this data:
$plot->SetDataColors(array('navy'));
# Specify Y range of this data set:
$plot->SetPlotAreaWorld(NULL, $lv, NULL, $uv);
$plot->SetYTickIncrement(.2);
$plot->SetYTickPos('plotright');
$plot->SetYTickLabelPos('plotright');
$plot->SetDataColors(array('black', 'gold', 'orchid'));
# Format Y tick labels as integers with trailing percent sign:
$plot->SetYLabelType('data', 2);
$plot->SetYTickAnchor(3.2);
$plot->SetPointSizes(array('4','4','4','3'));
$plot->SetLineWidths(array('1','1','1','4'));
$plot->SetPointShapes(array('plus','circle','circle'));
$plot->DrawGraph();
# Now output the graph with both plots:
if(!$debug) $plot->PrintImage();
################################################################################################################################################
Read Input Registers
";
deviceInit('/dev/ttyGW',9600,'none',8,2,'none');
// Open port
$modbus->deviceOpen();
// Enable debug
$modbus->debug = $debug;
#@# do stuff
# fetch one word beginning at hr 01 to display new contents
$new=$modbus->sendQuery(1,3,"0000", 2);
if($debug) print_r($new);
# fetch one word beginning at hr 01 and display existing contents
#$old=$modbus->sendQuery(1,6,"0000","0000",2);
#if($debug) print_r($old);
sleep(3);
# write single word(value=2) to hr 01
#$result=$modbus->sendQuery(1,6,1, 2);
#if($debug) print_r($result);
# fetch one word beginning at hr 01 to display new contents
$last=$modbus->sendQuery(1,3,"0000", 2);
if($debug) print_r($last);
if($debug) echo "
Do you see a value of 2 here and 'Utl' on GW blue screen? If yes, then success!/n";
echo "\n";
?>
deviceInit('/dev/ttyGW',9600,'none',8,2,'none');
// Open port
$modbus->deviceOpen();
// Enable debug
$modbus->debug = $debug;
#@# do stuff
# fetch one word beginning at hr 01 and display existing contents
$old=$modbus->sendQuery(1,3,1, 1);
if($debug) print_r($old);
# write single word(value=2) to hr 01
$result=$modbus->sendQuery(1,6,1, 2);
if($debug) print_r($result);
# fetch one word beginning at hr 01 to display new contents
$new=$modbus->sendQuery(1,3,2, 1);
if($debug) print_r($new);
if($debug) echo "
Do you see a value of 2 here and 'Utl' on GW blue screen? If yes, then success!/n";
echo "";
?>
deviceInit('/dev/ttyGW',9600,'none',8,2,'none');
// Open port
$modbus->deviceOpen();
// Enable debug
$modbus->debug = $debug;
#@# do stuff
# fetch one word beginning at hr 01 to display new contents
$new=$modbus->sendQuery(1,3,"002d", 2);
if($debug) print_r($new);
# fetch one word beginning at hr 01 and display existing contents
$old=$modbus->sendQuery(1,6,"002d","07e7",2);
if($debug) print_r($old);
sleep(3);
# write single word(value=2) to hr 01
#$result=$modbus->sendQuery(1,6,1, 2);
#if($debug) print_r($result);
# fetch one word beginning at hr 01 to display new contents
$last=$modbus->sendQuery(1,3,"002d", 2);
if($debug) print_r($last);
if($debug) echo "
Do you see a value of 2 here and 'Utl' on GW blue screen? If yes, then success!/n";
echo "\n";
?>
NC8Q PV wattage history
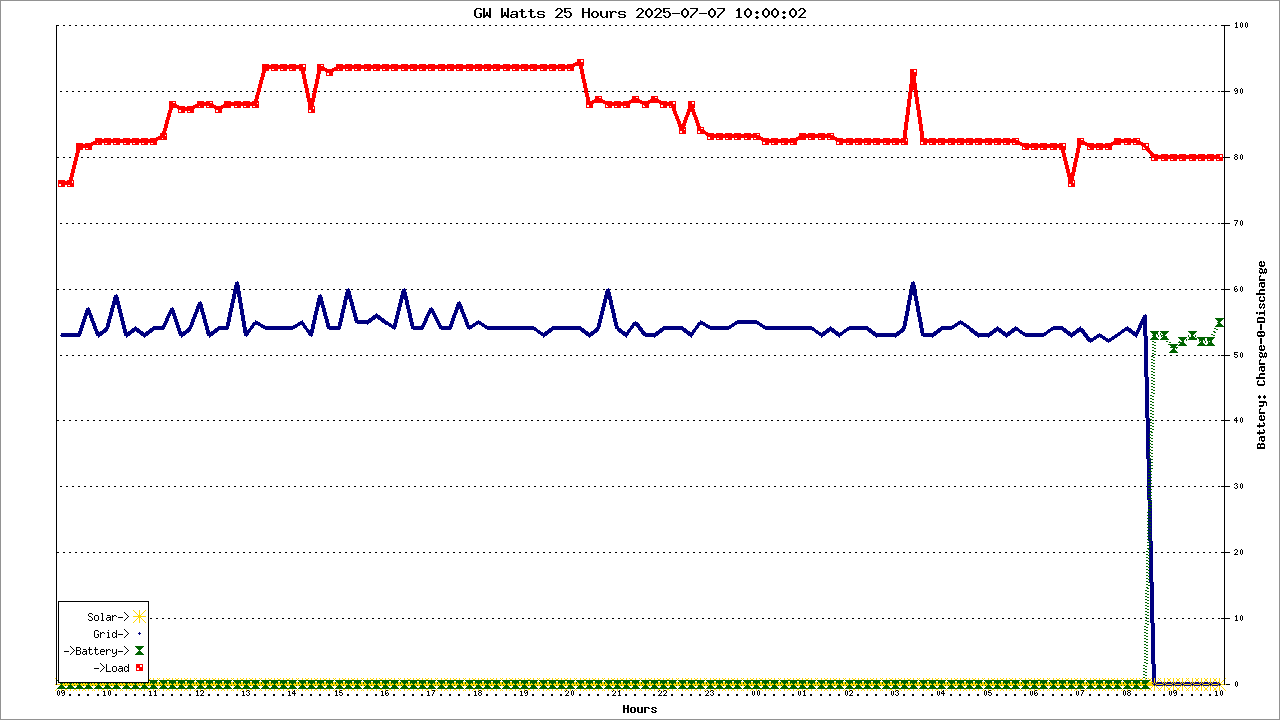
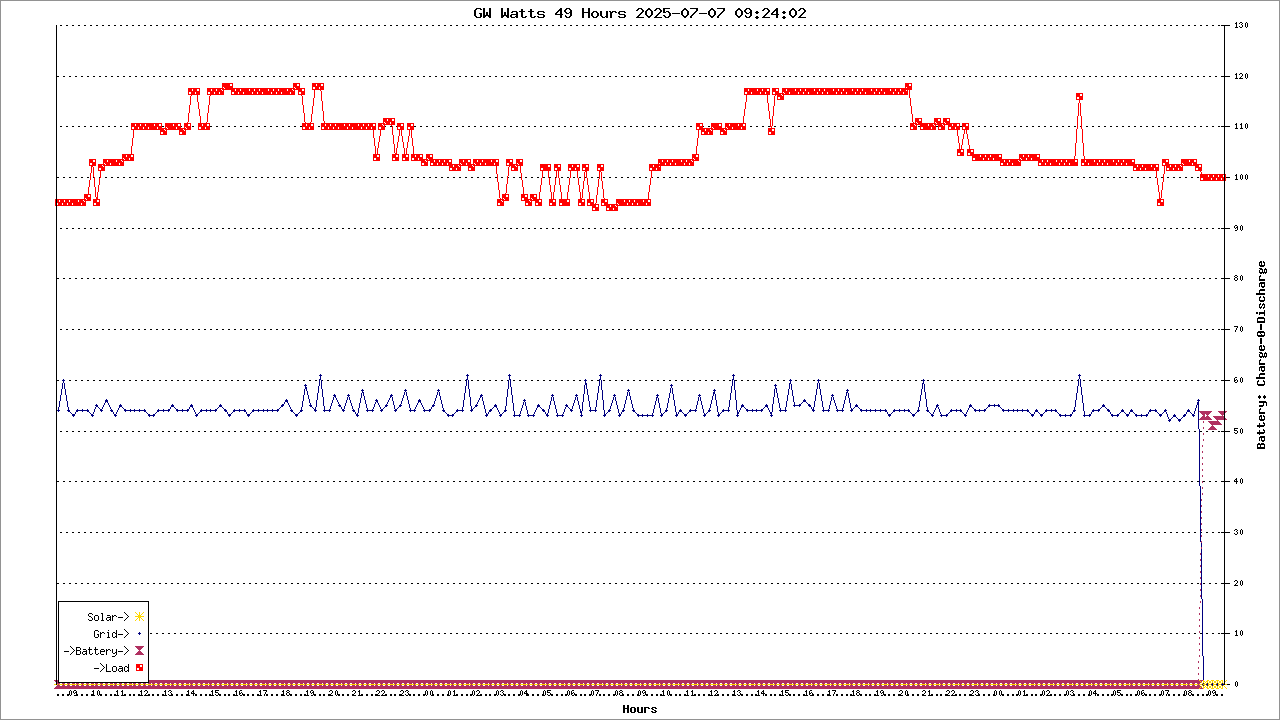
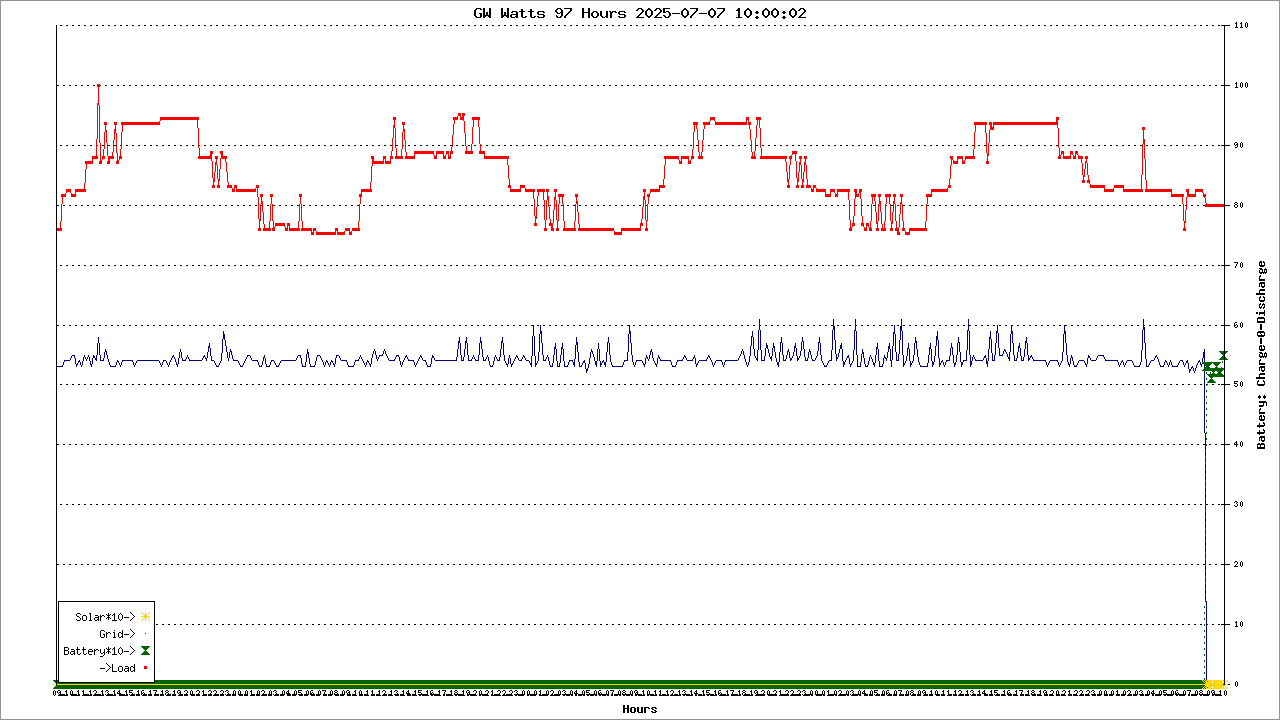
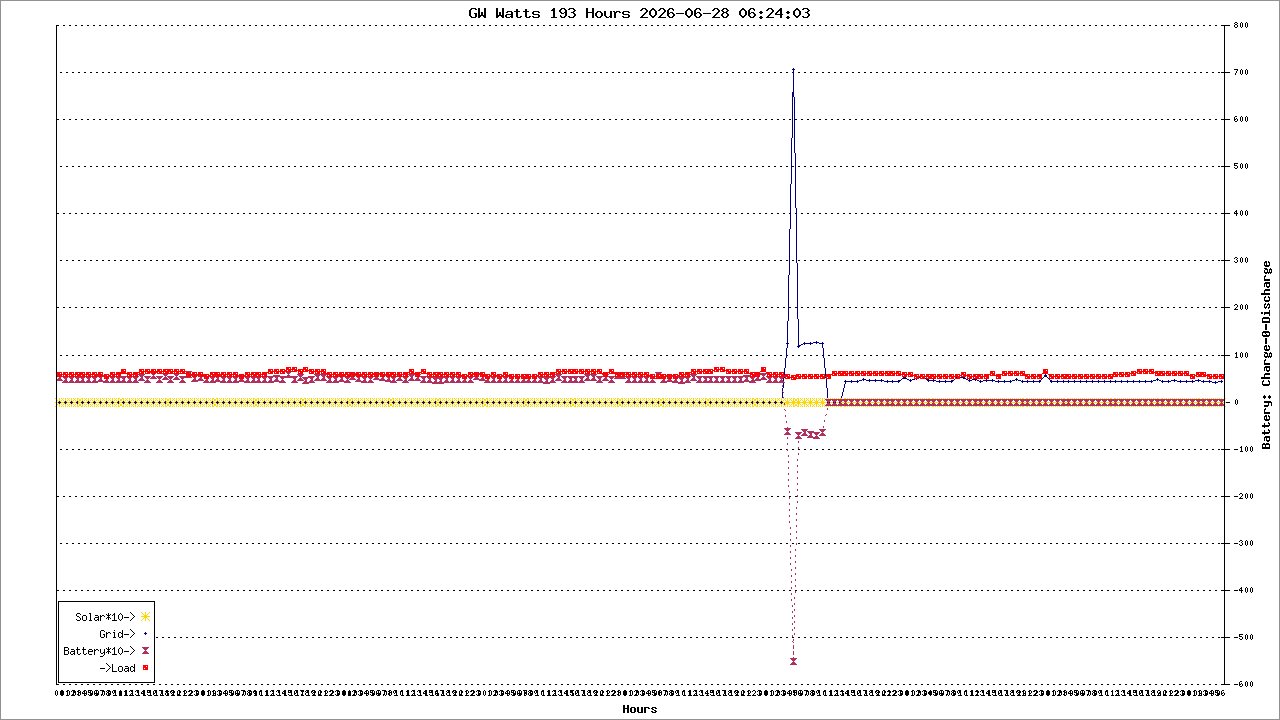 deviceInit('/dev/ttyGW',9600,'none',8,2,'none');
// Open port
$modbus->deviceOpen();
// Enable debug
$modbus->debug = $debug;
$day = system('date +%d', $retval);
$h_day=dechex($day);
echo $h_day;
#@# do stuff
# fetch one word beginning at hr 01 to display new contents
$read=$modbus->sendQuery(1,3,"002d", 3);
if($debug) print_r($read);
# fetch one word beginning at hr 01 and display existing contents
$whr=$modbus->sendQuery(1,6,"002f",$h_day,1);
if($debug) print_r($whr);
sleep(3);
# fetch one word beginning at hr 01 to display new contents
$thr=$modbus->sendQuery(1,3,"002d", 3);
if($debug) print_r($thr);
if($debug) echo "
deviceInit('/dev/ttyGW',9600,'none',8,2,'none');
// Open port
$modbus->deviceOpen();
// Enable debug
$modbus->debug = $debug;
$day = system('date +%d', $retval);
$h_day=dechex($day);
echo $h_day;
#@# do stuff
# fetch one word beginning at hr 01 to display new contents
$read=$modbus->sendQuery(1,3,"002d", 3);
if($debug) print_r($read);
# fetch one word beginning at hr 01 and display existing contents
$whr=$modbus->sendQuery(1,6,"002f",$h_day,1);
if($debug) print_r($whr);
sleep(3);
# fetch one word beginning at hr 01 to display new contents
$thr=$modbus->sendQuery(1,3,"002d", 3);
if($debug) print_r($thr);
if($debug) echo "
Do you see a correct day?/n";
echo "\n";
?>
deviceInit('/dev/ttyGW',9600,'none',8,2,'none');
// Open port
$modbus->deviceOpen();
// Enable debug
$modbus->debug = $debug;
$hour = system('date +%H', $retval);
$h_hour=dechex($hour);
echo $h_hour;
#@# do stuff
# fetch one word beginning at hr 01 to display new contents
$read=$modbus->sendQuery(1,3,"002d", 4);
if($debug) print_r($read);
# fetch one word beginning at hr 01 and display existing contents
$whr=$modbus->sendQuery(1,6,"0030",$h_hour,1);
if($debug) print_r($whr);
sleep(3);
# fetch one word beginning at hr 01 to display new contents
$thr=$modbus->sendQuery(1,3,"002d", 4);
if($debug) print_r($thr);
if($debug) echo "
Do you see a correct hour?/n";
echo "\n";
?>
deviceInit('/dev/ttyGW',9600,'none',8,2,'none');
// Open port
$modbus->deviceOpen();
// Enable debug
$modbus->debug = $debug;
$minute = system('date +%M', $retval);
$h_minute=dechex($minute);
echo $h_minute;
#@# do stuff
# fetch one word beginning at hr 01 to display new contents
$read=$modbus->sendQuery(1,3,"002d", 5);
if($debug) print_r($read);
# fetch one word beginning at hr 01 and display existing contents
$whr=$modbus->sendQuery(1,6,"0031",$h_minute,1);
if($debug) print_r($whr);
sleep(3);
# fetch one word beginning at hr 01 to display new contents
$thr=$modbus->sendQuery(1,3,"002d", 5);
if($debug) print_r($thr);
if($debug) echo "
Do you see a correct minute?/n";
echo "\n";
?>
deviceInit('/dev/ttyGW',9600,'none',8,2,'none');
// Open port
$modbus->deviceOpen();
// Enable debug
$modbus->debug = $debug;
$month = system('date +%m', $retval);
$h_month=dechex($month);
echo $h_month;
#@# do stuff
# fetch one word beginning at hr 01 to display new contents
$read=$modbus->sendQuery(1,3,"002d", 2);
if($debug) print_r($read);
# fetch one word beginning at hr 01 and display existing contents
$whr=$modbus->sendQuery(1,6,"002e",$h_month,1);
if($debug) print_r($whr);
sleep(3);
# fetch one word beginning at hr 01 to display new contents
$thr=$modbus->sendQuery(1,3,"002d", 2);
if($debug) print_r($thr);
if($debug) echo "
Do you see a correct month?/n";
echo "\n";
?>
deviceInit('/dev/ttyGW',9600,'none',8,2,'none');
// Open port
$modbus->deviceOpen();
// Enable debug
$modbus->debug = $debug;
$second = system('date +%S', $retval);
$h_second=dechex($second);
echo $h_second;
#@# do stuff
# fetch one word beginning at hr 01 to display new contents
$read=$modbus->sendQuery(1,3,"002d", 6);
if($debug) print_r($read);
# fetch one word beginning at hr 01 and display existing contents
$whr=$modbus->sendQuery(1,6,"0032",$h_second,1);
if($debug) print_r($whr);
sleep(3);
# fetch one word beginning at hr 01 to display new contents
$thr=$modbus->sendQuery(1,3,"002d", 6);
if($debug) print_r($thr);
if($debug) echo "
Do you see a correct second?/n";
echo "\n";
?>
deviceInit('/dev/ttyGW',9600,'none',8,2,'none');
#$modbus->deviceInit('/dev/ttyUSB0',9600,'none',8,2,'none');
// Open port
$modbus->deviceOpen();
// Enable debug
$modbus->debug = $debug;
$year = system('date +%Y', $retval);
$h_year=dechex($year);
echo $h_year;
echo "\n";
#@# do stuff
# fetch one word beginning at hr 01 to display new contents
$rhr=$modbus->sendQuery(1,3,"005f", 1);
if($debug) print_r($rhr);
# fetch one word beginning at hr 01 and display existing contents
#$whr=$modbus->sendQuery(1,6,"005f",$h_year,1);
#if($debug) print_r($whr);
sleep(3);
# write single word(value=2) to hr 01
#$result=$modbus->sendQuery(1,6,1, 2);
#if($debug) print_r($result);
# fetch one word beginning at hr 01 to display new contents
$thr=$modbus->sendQuery(1,3,"005f", 1);
if($debug) print_r($thr);
if($debug) echo "
Do you see a value of 2 here and 'Utl' on GW blue screen? If yes, then success!/n";
echo "\n";
?>
deviceInit('/dev/ttyGW',9600,'none',8,2,'none');
#$modbus->deviceInit('/dev/ttyUSB0',9600,'none',8,2,'none');
// Open port
$modbus->deviceOpen();
// Enable debug
$modbus->debug = $debug;
$year = system('date +%Y', $retval);
$h_year=dechex($year);
echo $h_year;
echo "\n";
#@# do stuff
# fetch one word beginning at hr 01 to display new contents
$rhr=$modbus->sendQuery(1,3,"002d", 1);
if($debug) print_r($rhr);
# fetch one word beginning at hr 01 and display existing contents
$whr=$modbus->sendQuery(1,6,"002d",$h_year,1);
if($debug) print_r($whr);
sleep(3);
# write single word(value=2) to hr 01
#$result=$modbus->sendQuery(1,6,1, 2);
#if($debug) print_r($result);
# fetch one word beginning at hr 01 to display new contents
$thr=$modbus->sendQuery(1,3,"002d", 1);
if($debug) print_r($thr);
if($debug) echo "
Do you see a value of 2 here and 'Utl' on GW blue screen? If yes, then success!/n";
echo "\n";
?>